


Next: Fluence Distribution
Up: GRBM Localization Technique Limits
Previous: Mean Error Radius
Contents
As already tested in the previous section, the GRBM localization technique
is reliable, since the  90% of the bursts lie within the GRBM 90% CL
error region. Here the behavior of the direction matrix is studied:
in other words, the purpose is to study how this localization technique
locates a given set of bursts, to test if there are any trends and/or
whether it clusters, and possibly what are the local directions where
this clustering effect might work.
90% of the bursts lie within the GRBM 90% CL
error region. Here the behavior of the direction matrix is studied:
in other words, the purpose is to study how this localization technique
locates a given set of bursts, to test if there are any trends and/or
whether it clusters, and possibly what are the local directions where
this clustering effect might work.
Figure:
GRBM Direction Distribution of a sample of 446 GRBs localized
with the GRBM localization technique. The frame of reference is local
to BeppoSAX. The clustering tendency in the nearby of the BeppoSAX
equatorial plane is apparent.
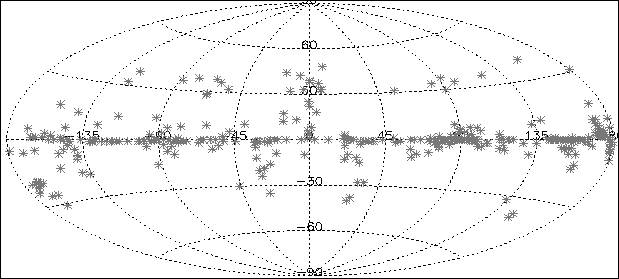 |
In fig. ![[*]](crossref.png) the distribution of 446 directions,
estimated with the GRBM localization technique, referred to the BeppoSAX
local frame of reference is shown; for clarity,
only the centroids have been spotted; although, on average, the error
regions of the overall set of bursts would overlay also high elevation
regions, nevertheless, a clear evidence for clustering of centroid
positions in the nearby of the BeppoSAX equatorial plane.
In particular, it is now well known that the GRBM localization
capabilities dramatically get worse when approaching the local south
pole, where the off-line trigger efficiency falls down to 24-25%
(see table ).
the distribution of 446 directions,
estimated with the GRBM localization technique, referred to the BeppoSAX
local frame of reference is shown; for clarity,
only the centroids have been spotted; although, on average, the error
regions of the overall set of bursts would overlay also high elevation
regions, nevertheless, a clear evidence for clustering of centroid
positions in the nearby of the BeppoSAX equatorial plane.
In particular, it is now well known that the GRBM localization
capabilities dramatically get worse when approaching the local south
pole, where the off-line trigger efficiency falls down to 24-25%
(see table ).
At this stage, it is not possible to study the isotropy of the burst
subset, that have been localized thanks to the GRBM only, owing
to two facts: the first is apparent from fig. ,
because of this clustering effect; the second is that the 90% CL
error regions of every GRBM-positioned burst is too large (15-40 )
for searching for a possible anyhow small anisotropy.
)
for searching for a possible anyhow small anisotropy.
The clustering behavior of the GRBM direction matrix becomes more
apparent in the two figg. and
, where the GRBM direction
distributions for two GRB subset are shown: the first figure shows
how the GRBM-BATSE (4B) common sample of 152 GRBs localized by both GRBM
and BATSE, are distributed within the BeppoSAX local sky; both sets
of directions are shown together, i.e. GRBM and BATSE directions of
the same bursts: since the BATSE is much smaller (a systematic error
of
 against the GRBM systematic error of
 ),
these are taken as the true GRB positions. The clustering effect
above claimed here is indeed clear.
),
these are taken as the true GRB positions. The clustering effect
above claimed here is indeed clear.
Figure:
Direction Distribution of the GRBM-BATSE (4B) common
sample of 152 GRBs localized with the GRBM localization technique.
The frame of reference is local to BeppoSAX. Both GRBM and BATSE
positions are spotted. The clustering tendency in the nearby of the BeppoSAX
equatorial plane is apparent, when compared with the BATSE distribution.
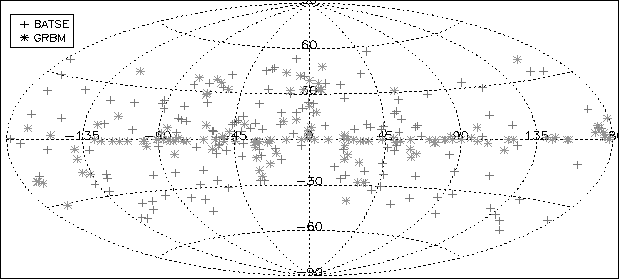 |
Figure:
Direction Distribution of a sample of 45 GRBs, that have been
localized with the GRBM localization technique, and whose position was
already known thanks to other experiments, mainly WFC and IPN.
The frame of reference is local to BeppoSAX. Both GRBM and true positions
are shown.
The clustering tendency in the nearby of the BeppoSAX equatorial plane
is apparent.
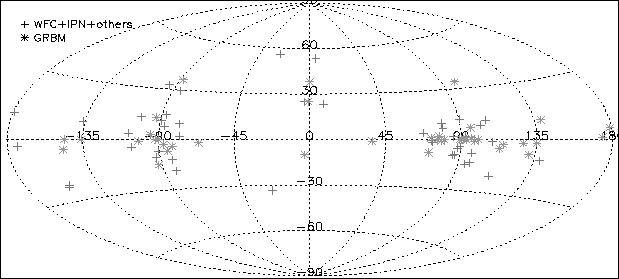 |
The same operation has been made for the common sample
of 45 well localized bursts, and the outcoming distribution is shown
in fig. ; also in this case
a kind of clustering effect is apparent near the local equatorial
plane, although it should not be confused with the obvious clustering
of bursts in the nearby of the fields of view of WFC1 and WFC2,
at
 , and
, and
 , respectively (
 ),
corresponding to the WFC local normal directions, given that
the major contribution to this set of precisely localized GRBs
comes from the WFCs' own detections.
),
corresponding to the WFC local normal directions, given that
the major contribution to this set of precisely localized GRBs
comes from the WFCs' own detections.
Next: Fluence Distribution
Up: GRBM Localization Technique Limits
Previous: Mean Error Radius
Contents
Cristiano Guidorzi
2003-07-31