


Next: GRBM Direction Matrix Behavior
Up: GRBM Localization Technique Limits
Previous: GRBM Localization Technique Limits
Contents
In fig. ![[*]](crossref.png) the distribution of the
angular distance between the true direction of the 45 well localized
GRBs and the direction derived with the GRBM, is shown.
In spite of the small number of bursts, this subset is the most
reliable, since the uncertainties (
the distribution of the
angular distance between the true direction of the 45 well localized
GRBs and the direction derived with the GRBM, is shown.
In spite of the small number of bursts, this subset is the most
reliable, since the uncertainties (
 ) on the true positions can be
neglected, so that only the systematic and statistical errors due to
the GRBM estimate have to be taken into account.
) on the true positions can be
neglected, so that only the systematic and statistical errors due to
the GRBM estimate have to be taken into account.
Figure:
GRBM-true Position Angular Distance Distribution. The sample
only includes 45 well localized GRBs (WFC, IPN, etc...).
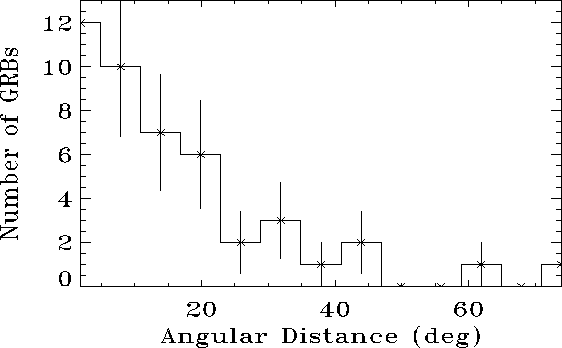 |
About 90% true positions indeed lie within the GRBM error 90% CL regions,
inclusive of 10 systematic.
The same angular distance distributions in two cases have been taken into
studied as well: in figg. and
the GRBM-BATSE 4B and GRBM-BATSE
4B+Kommers'+Stern's common GRBs distributions are shown, respectively;
also in this case, only the GRBs, that could have been positioned
by the GRBM, have been taken into consideration.
In these figures, only the GRBM centroid coordinates and the BATSE
positions have been used, with no care about their uncertainties;
nevertheless, from these figures it can be easily realized that,
from
systematic.
The same angular distance distributions in two cases have been taken into
studied as well: in figg. and
the GRBM-BATSE 4B and GRBM-BATSE
4B+Kommers'+Stern's common GRBs distributions are shown, respectively;
also in this case, only the GRBs, that could have been positioned
by the GRBM, have been taken into consideration.
In these figures, only the GRBM centroid coordinates and the BATSE
positions have been used, with no care about their uncertainties;
nevertheless, from these figures it can be easily realized that,
from  to
to
 angular deviation the number of bursts
looks not to change significantly; on the other hand, a very few cases
show angular distances
angular deviation the number of bursts
looks not to change significantly; on the other hand, a very few cases
show angular distances
 . This somehow gives an idea of
a ``mean'' angular dimension of the GRBM error regions, though these
often show oblong CL profiles, especially along the local elevation
(
. This somehow gives an idea of
a ``mean'' angular dimension of the GRBM error regions, though these
often show oblong CL profiles, especially along the local elevation
( angle) dimension (see some figures from
section ).
angle) dimension (see some figures from
section ).
Figure:
GRBM-BATSE Position Angular Distance Distribution. The sample
only includes 152 BATSE 4B GRBs, that have been localized also with the GRBM
localization technique.
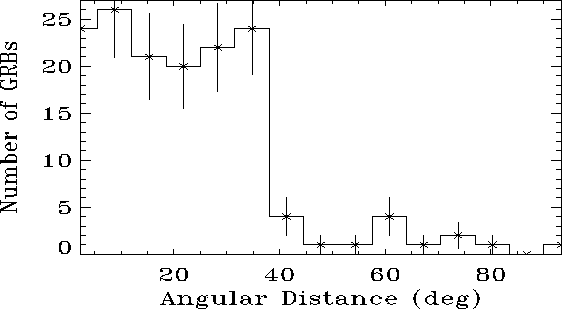 |
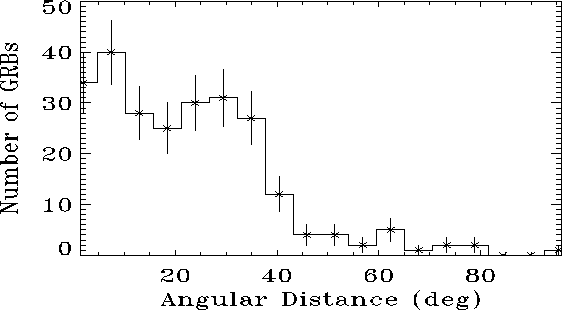
Figure:
GRBM-BATSE Position Angular Distance Distribution. The sample
only includes 203 BATSE (4B+Kommers'+Stern's) GRBs, that have been
localized also with the GRBM localization technique.
 |
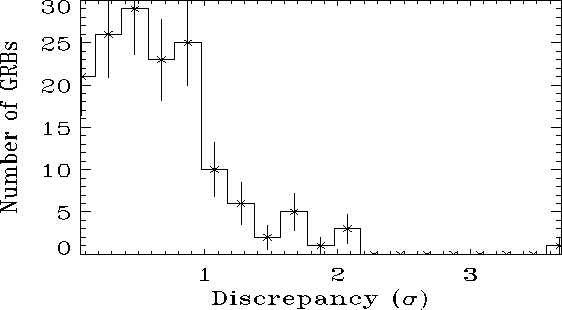
In order to test the consistency of the GRBM and BATSE localizations,
in fig. the distribution of the
discrepancies between the GRBM and the BATSE (4B only) positions
of 152 common bursts is shown. The discrepancy used is the
angular distances, expressed in terms of  , where is
calculated according to the eq. :
, where is
calculated according to the eq. :
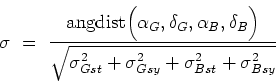 |
(44) |
where
 are the GRBM centroid coordinates,
 the BATSE center coordinates,
and
the BATSE center coordinates,
and
 are the
statistical (
are the
statistical ( ) and systematic (
 ) uncertainties of the GRBM (
 )
and BATSE (
)
and BATSE ( ) positions; the following values have been assumed:
 and
and
 ([Meegan et al., 1996,Paciesas et al., 1999]). The GRBM statistical error
  must be interpreted
as the 90% CL mean error radius
must be interpreted
as the 90% CL mean error radius  discussed in
section ).
discussed in
section ).
Figure:
GRBM-BATSE Position Discrepancy Distribution. The sample
only includes 152 BATSE 4B GRBs, that have been
localized also with the GRBM localization technique. The discrepancy
takes into account both the total error (90% CL) owing to the GRBM localization
and the total BATSE error, with
 systematic for the latter.
 |
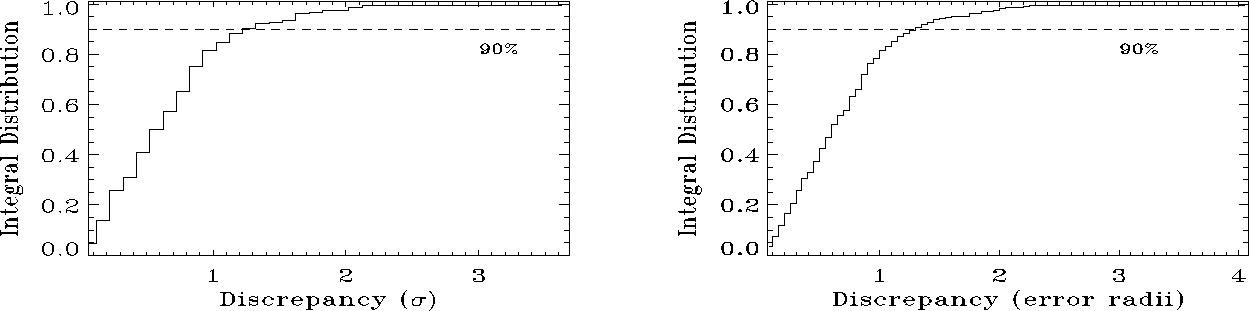
From eq. it should be expected that  90%
of the GRBM-BATSE bursts considered should have discrepancies lower
than 1; this property can be more easily verified, when
considering the integral distribution of the discrepancies, as shown
in figg. for both cases: 152 GRBM-BATSE
(4B only) shared bursts, and 203 GRBM-BATSE (4B+Kommers'+Stern's)
shared bursts, respectively.
From these figures, it seems that the 90% of bursts have discrepancies
lower than
90%
of the GRBM-BATSE bursts considered should have discrepancies lower
than 1; this property can be more easily verified, when
considering the integral distribution of the discrepancies, as shown
in figg. for both cases: 152 GRBM-BATSE
(4B only) shared bursts, and 203 GRBM-BATSE (4B+Kommers'+Stern's)
shared bursts, respectively.
From these figures, it seems that the 90% of bursts have discrepancies
lower than
 instead of
  ; nevertheless this
looks like being quite consistent with the above expectation, although
the uncertainties are not shown in these figures.
; nevertheless this
looks like being quite consistent with the above expectation, although
the uncertainties are not shown in these figures.
Figure:
GRBM-BATSE Position Discrepancy Integral Distributions. The sample
only includes 152 BATSE 4B (top panel) and 203 BATSE 4B+Kommers'+Stern's
(bottom panel) GRBs, that have been
localized also with the GRBM localization technique. The discrepancy
takes into account both the total error (90% CL) owing to the GRBM localization
and the total BATSE error, with
systematic for the latter.
 |
This argument indirectly confirms that the GRBM systematic error in
positioning is around
 .
.
Next: GRBM Direction Matrix Behavior
Up: GRBM Localization Technique Limits
Previous: GRBM Localization Technique Limits
Contents
Cristiano Guidorzi
2003-07-31