


Next: Other Transients
Up: The GRB Catalog
Previous: GRBM Direction Matrix Behavior
Contents
To date, the fluences of the GRBs of this GRBM catalog,
are expressed in terms of counts, since the GRBM response
matrix has become available only recently (Dec 2001).
Nevertheless, four distributions have been extracted:
two fluence distributions, one for each energy bands,
and two peak count rate distributions for both energy bands.
The fluences (counts) used for these distributions are the total counts
summed over the four GRBM units; the same operation has been
repeated for the peak count rates, expressed in counts/s.
This way, the derived distributions have not been corrected
for the different effective areas, depending on the
GRB arrival direction with respect to the BeppoSAX local frame
of reference; on the other side, the sum over the four GRBM units
somehow accounts for this directional effect;
furthermore, the high number of GRBs contributes to average this
effect.
Figure:
Top panel: cumulative fluence distribution (40-700 keV).
The solid line shows the best powerlaw fit
 ,
with
,
with
 ; the dashed line shows the case
 .
Bottom panel: cumulative peak countrate distribution (40-700 keV);
the best fit gives
.
Bottom panel: cumulative peak countrate distribution (40-700 keV);
the best fit gives
 .
.
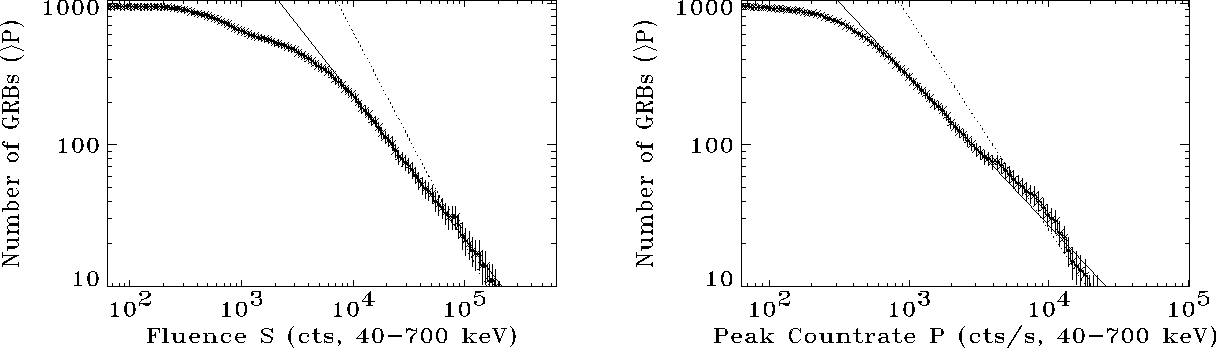 |
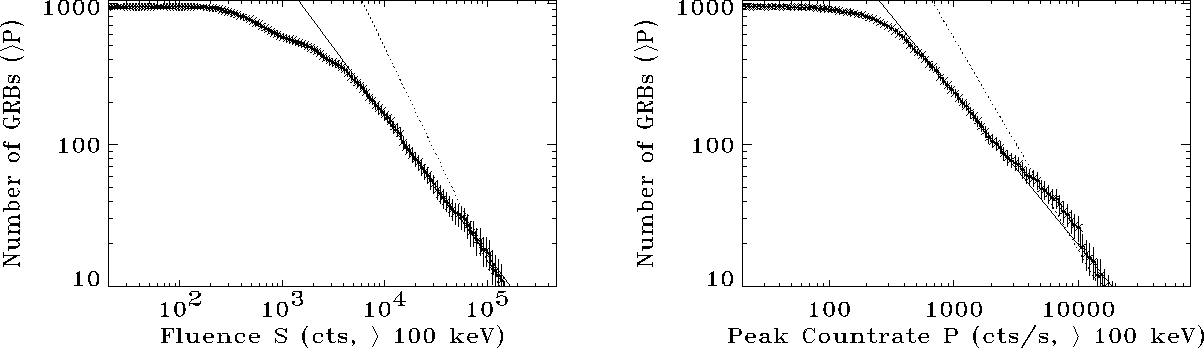
Figure:
Top panel: cumulative fluence distribution ( 100 keV).
The solid line shows the best powerlaw fit
,
with
100 keV).
The solid line shows the best powerlaw fit
,
with
 ; the dashed line shows the case
.
Bottom panel: cumulative peak countrate distribution ( 100 keV);
the best fit gives
; the dashed line shows the case
.
Bottom panel: cumulative peak countrate distribution ( 100 keV);
the best fit gives
 .
.
 |
In figg. ![[*]](crossref.png) the two cumulative distributions of the
fluences and of the peak count rates in the 40-700 keV are shown.
In the case of a homogeneous distribution within an euclidean space,
it should be expected that
and
the two cumulative distributions of the
fluences and of the peak count rates in the 40-700 keV are shown.
In the case of a homogeneous distribution within an euclidean space,
it should be expected that
and
 ,
,  ,
where
,
where  is the fluence (counts) and
  is the number of GRBs
with fluence greater than ,
is the number of GRBs
with fluence greater than ,  is the peak count rate (counts/s)
and
is the peak count rate (counts/s)
and  is the number of GRBs with peak count rate greater than .
In figg the same distributions concerning the
100 keV band are shown.
A power law fit has been performed in the following ranges:
is the number of GRBs with peak count rate greater than .
In figg the same distributions concerning the
100 keV band are shown.
A power law fit has been performed in the following ranges:
 cts
cts
 cts for the fluence distributions,
and
cts for the fluence distributions,
and  cts
cts
 for the peak count rate
distributions; these ranges have been chosen by visual inspection.
for the peak count rate
distributions; these ranges have been chosen by visual inspection.
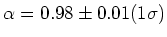
The parameter  estimated by means of power law fits
for the various distributions are the
following:
estimated by means of power law fits
for the various distributions are the
following:  (fluence, 40-700 keV),
 (fluence, 100 keV),
 (peak count rate, 40-700 keV),
 (peak count rate, 100 keV);
the uncertainties are
(peak count rate, 100 keV);
the uncertainties are  .
These distributions suggest a different behavior of the GRB population
from the case , and this property agrees with the well
known properties of the BATSE catalogs ([Meegan et al., 1996,Paciesas et al., 1999]).
.
These distributions suggest a different behavior of the GRB population
from the case , and this property agrees with the well
known properties of the BATSE catalogs ([Meegan et al., 1996,Paciesas et al., 1999]).
Next: Other Transients
Up: The GRB Catalog
Previous: GRBM Direction Matrix Behavior
Contents
Cristiano Guidorzi
2003-07-31