The crust surrounding SNO+
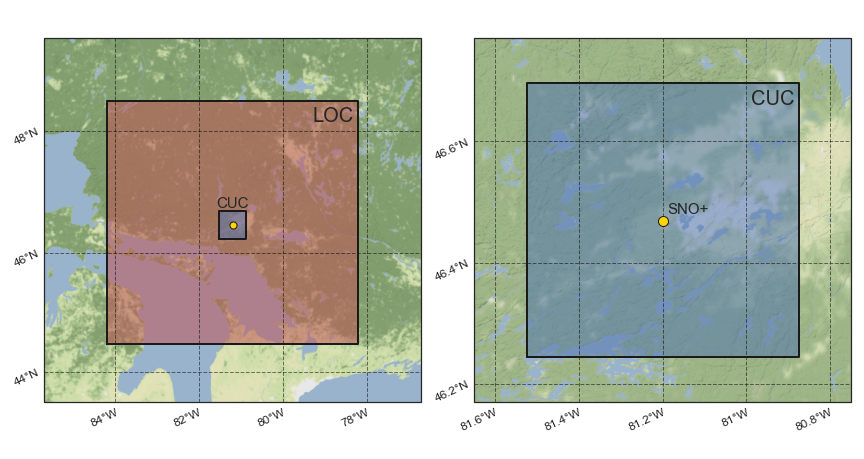
This web page provides the numerical 3D geophysical models of the crustal portion surrounding the SNO+ detector, a liquid scintillator detector located at SNOLAB underground physics laboratory (46.47° N, 81.20° W, Sudbury, Ontario, Canada).
The model of the LOcal Crust (LOC) belonging to the 6° x 4° (∼ 440 km x 460 km) region centered at SNOLAB is provided with a resolution of 1 km x 1 km x 0.1 km.
A high-resolution model (1 km x 1 km x 1 km) is available for the Close Upper Crust (CUC) corresponding to the 50 km x 50 km region centered at the detector.
Detailed information about these models are published in:
The model of the LOC can be requested by email to radioactivity@fe.infn.it.
The model of the CUC can be downloaded at this link:
The Local Crust
The 3D geophysical model of the LOC was constructed from compiled geological and geophysical information. Crustal cross sections obtained from refraction and reflection seismic surveys were used to characterize the crust and assign uncertainties to its structure.
The Upper Crust was divided into seven dominant lithologic units on the basis of regional geological features (characteristic lithologies, metamorphism, tectonic events, U and Th abundances). Some interpreted crustal cross sections based upon seismic experiments were used to define the contacts between the units.
| Lithology/Geology | Thickness [km] | Volume [106 km3] | Volume [%] | Density [g/cm3] | Mass [1018 kg] |
| Tonalite/Tonalite gneiss (Wawa-Abitibi) | 16.6 | 2.51 | 60.6 | 2.73 ± 0.08 | 6.9 ± 0.5 |
| Central Gneiss Belt (Grenville Province) | 14.5 | 1.25 | 30.2 | 2.73 ± 0.08 | 3.4 ± 0.2 |
| (Meta)volcanic rocks (Abitibi subprovince) | 5.5 | 0.12 | 2.9 | 2.84 ± 0.14 | 0.34 ± 0.01 |
| Paleozoic sedimentary rocks | 1.1 | 0.06 | 1.3 | 2.62 ± 0.19 | 0.16 ± 0.01 |
| Granite or granodiorite (Wawa-Abitibi) | 5.2 | 0.09 | 2.2 | 2.67 ± 0.02 | 0.24 ± 0.00 |
| Huronian Supergroup, Sudbury Basin | 4.4 | 0.11 | 2.7 | 2.69 ± 0.04 | 0.30 ± 0.01 |
| Sudbury Igneous Complex | 6.1 | 0.006 | 0.1 | 2.8 ± 0.1 | 0.02 ± 0.00 |
The Close Upper Crust
The 3D geophysical model of the CUC comprises 9 geological units defined considering the surface exposure described in the 1:250,000 scale Bedrock Geology of Ontario, conveniently simplified according to the spatial resolution of the available information about crustal structure.
The contacts between the units are defined combining multiple geological and geophysical inputs: (i) the contacts of the simplified geological map, (ii) the map of depth of the top of the middle crust of the LOC model, the 2.5-D geological modelsa along six profiles used for constructing the 3-D model reported in Olaniyan et al. (2015), and (v) five virtual cross sections derived from the LOC model. The surface topography for the CUC region uses the digital elevation modelb produced by the Shuttle Radar Topographic Mission.
| Label | Reservoir | Volume [103 km3] | Volume [%] | Density [g/cm3] | Mass [1015 kg] |
| GT | Gneissic Tonalite suite | 29.69 ± 1.40 | 63.7 | 2.73 ± 0.08 | 81.05 ± 5.01 |
| HI | Huronian Supergroup and minor Intrusions | 10.52 ± 0.49 | 22.6 | 2.75 ± 0.04 | 28.93 ± 1.79 |
| NG | Norite-gabbro, Sudbury Igneous Complex | 2.64 ± 0.12 | 5.7 | 2.83 ± 0.10 | 7.47 ± 0.46 |
| GN | Granophyre, Sudbury Igneous Complex | 1.43 ± 0.07 | 3.1 | 2.70 ± 0.10 | 3.86 ± 0.32 |
| OP | Onaping Fm., Whitewater Group | 0.94 ± 0.04 | 2.0 | 2.77 ± 0.04 | 2.60 ± 0.22 |
| GF | Grenville Front Tectonic Zone rocks | 0.83 ± 0.04 | 1.8 | 2.73 ± 0.08 | 2.27 ± 0.12 |
| OW | Onwatin Fm., Whitewater Group | 0.30 ± 0.01 | 0.6 | 2.68 ± 0.04 | 0.80 ± 0.05 |
| CM | Chelmsford Fm., Whitewater Group | 0.23 ± 0.01 | 0.5 | 2.75 ± 0.04 | 0.62 ± 0.05 |
| CT | Cartier Granite | 0.04 ± 0.002 | 0.1 | 2.65 ± 0.02 | 0.11 ± 0.01 |