


Next: Long Time Scale Modulations
Up: The GRB Search Algorithms
Previous: The GRB Search Algorithms
Contents
The data used for the GRB quest are the continuous 1 s ratemeters
in two energy bands, 40-700 and  100 keV, from each of
the four detector units.
Because of the two usages of the GRBM (sec.
100 keV, from each of
the four detector units.
Because of the two usages of the GRBM (sec. ![[*]](crossref.png) ),
the 40-700 keV band is called ``GRBM'' band
(since the on-board trigger logic processes the 40-700 keV counts)
and the 100 keV band is called ``AC'' band
(since the AntiCoincidence shielding for the PDS
detectors is applied to
events that lose energies 100 keV in the GRBM).
Hereafter, these names are adopted.
),
the 40-700 keV band is called ``GRBM'' band
(since the on-board trigger logic processes the 40-700 keV counts)
and the 100 keV band is called ``AC'' band
(since the AntiCoincidence shielding for the PDS
detectors is applied to
events that lose energies 100 keV in the GRBM).
Hereafter, these names are adopted.
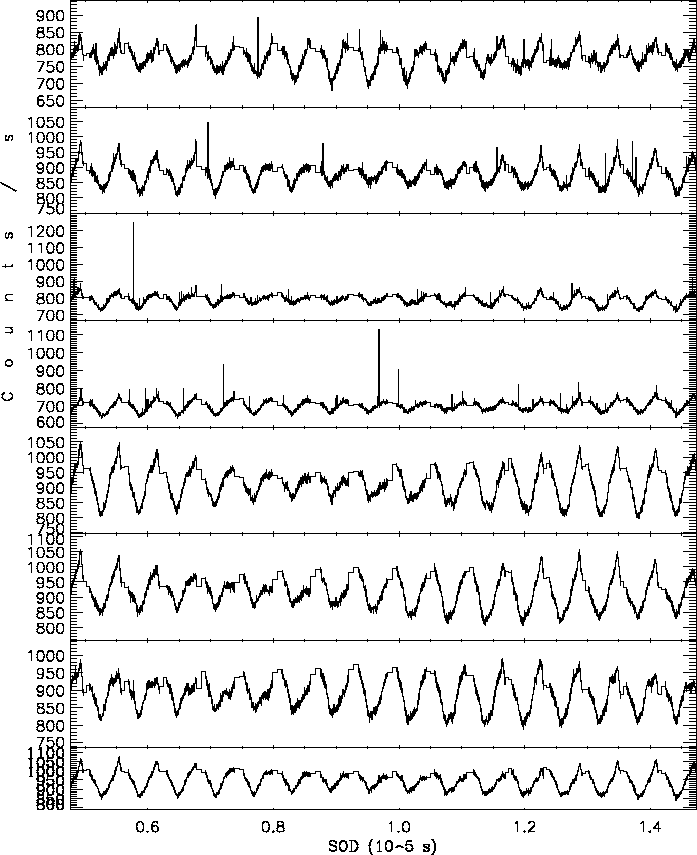
Figure:
GRBM 1 s light curves, one for each energy band and for each unit
(OP 11729, from July 31 to August 1, 2001). From top to bottom, the GRBM 1-4
and AC 1-4 bands are plotted. The duration is  s.
The count rates are measured in counts/s: actually, for clarity,
these rates are the averages of 20 s bins; however, in the GRBM band,
softer than the AC band, it is apparent that there are more spikes.
The repetitive structures have the same periodicity of the BeppoSAX orbital
period; the periodic data gaps correpond to the SAGA passages.
s.
The count rates are measured in counts/s: actually, for clarity,
these rates are the averages of 20 s bins; however, in the GRBM band,
softer than the AC band, it is apparent that there are more spikes.
The repetitive structures have the same periodicity of the BeppoSAX orbital
period; the periodic data gaps correpond to the SAGA passages.
 |
Subsections
Next: Long Time Scale Modulations
Up: The GRB Search Algorithms
Previous: The GRB Search Algorithms
Contents
Cristiano Guidorzi
2003-07-31