![[*]](crossref.png) ,
shows long timescale (
,
shows long timescale (The modulation of the amplitudes is caused by the the modulation of the geomagnetic cut-off orbit with time: one property of such an orbit is that it drifts with time and, therefore, the detectors' noise caused by the particles trapped by the Earth magnetic field changes consequently.
It is worth emphasizing the greater number of spikes in the 40-700 keV
light curves than in the ![]() 100 keV band: these spikes are caused by
high-energy charged particles crossing the detector slabs.
For a more detailed description of these transient events, that are
the most frequent, see later on.
100 keV band: these spikes are caused by
high-energy charged particles crossing the detector slabs.
For a more detailed description of these transient events, that are
the most frequent, see later on.
The mean count rate typically ranges between 700 and 1200 counts/s,
depending on the energy band, on the threshold values (LLT, ULT, ACT)
defining the bands, on the unit: e.g., GRBM 2 is always pointing to the
Sun within ![]() 30-40
30-40![]() , so that its GRBM band mean count rate
strongly reflects the solar X-ray activity: in fig. the mean
rate is little greater than the other units. However, other sources,
that may face the detectors, contribute the ratemeters' background and
their contribution is often modulated by the periodic occultations behind
the Earth.
, so that its GRBM band mean count rate
strongly reflects the solar X-ray activity: in fig. the mean
rate is little greater than the other units. However, other sources,
that may face the detectors, contribute the ratemeters' background and
their contribution is often modulated by the periodic occultations behind
the Earth.
While Fig. shows an example of the GRBM ratemeters during
several contiguous orbits, as they are stored in the FOT data,
fig. shows the case of a single orbit:
each of these data sets is scanned, soon after download,
for performing the search of transient events like GRBs or SGRs.
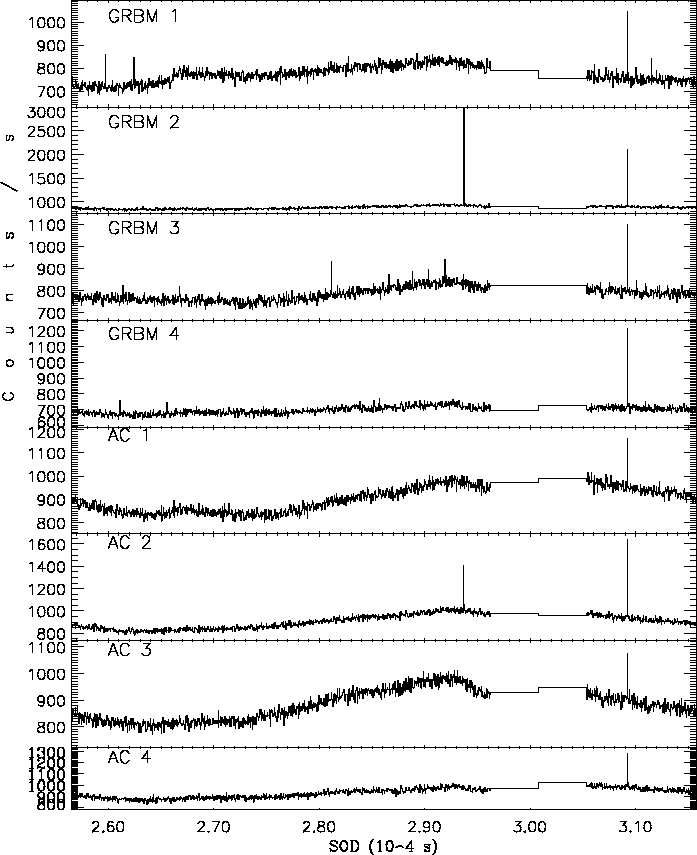 |
Here a data gap due to the SAGA passage can be clearly seen: it lasts
![]() 900 s, and it usually ranges between 600 s and 1200 s.
In this example, concerning orbit n. 26855, the GRB010802 is visible
at
900 s, and it usually ranges between 600 s and 1200 s.
In this example, concerning orbit n. 26855, the GRB010802 is visible
at ![]() 31000 s, just after the SAGA transit.
There is also an intense spike in the unit 2, GRBM band (GRBM 2)
around
31000 s, just after the SAGA transit.
There is also an intense spike in the unit 2, GRBM band (GRBM 2)
around ![]() 29400 s: a smaller trace of it can be seen in AC 2, as well.
The main difference between the GRB and the spike can be easily appreciated:
while the GRB, very strong, is clearly seen in every unit, in both the
energy bands, on the other side the spike is detected only in unit 2:
although this feature does not suffice to exclude the possibility
of a burst, its spectral softness with respect the usual burst hardness
is conclusive (the main differences between the spectral and
temporal peculiarities of the several classes of transient events detected
by the GRBM are thoroughly examined later on).
29400 s: a smaller trace of it can be seen in AC 2, as well.
The main difference between the GRB and the spike can be easily appreciated:
while the GRB, very strong, is clearly seen in every unit, in both the
energy bands, on the other side the spike is detected only in unit 2:
although this feature does not suffice to exclude the possibility
of a burst, its spectral softness with respect the usual burst hardness
is conclusive (the main differences between the spectral and
temporal peculiarities of the several classes of transient events detected
by the GRBM are thoroughly examined later on).