


Next: Spikes
Up: Medium and Short Time
Previous: Medium and Short Time
Contents
Normally, this component is responsible for the largest contribution to the
ratemeters of each unit in both energy bands: its counts are produced by the
diffuse X- and  radiation, cosmic rays and other high energy
particles. As already said, the mean count rate usually varies in the
range 700-1200 counts/s (sometimes up to 1900-2000 c/s in the 40-700
keV band, especially during the early OPs),
and mostly depends on the on-board thresholds,
on the Earth magnetic field cut-off rigidity at the BeppoSAX place
and on the sky portion facing each detector unit (Earth or whatever
X- and -ray sources).
This component is characterized by a poissonian statistics, except for
a few cases, in which the standard deviation is found to be significantly
greater than the square root of the mean counts.
radiation, cosmic rays and other high energy
particles. As already said, the mean count rate usually varies in the
range 700-1200 counts/s (sometimes up to 1900-2000 c/s in the 40-700
keV band, especially during the early OPs),
and mostly depends on the on-board thresholds,
on the Earth magnetic field cut-off rigidity at the BeppoSAX place
and on the sky portion facing each detector unit (Earth or whatever
X- and -ray sources).
This component is characterized by a poissonian statistics, except for
a few cases, in which the standard deviation is found to be significantly
greater than the square root of the mean counts.
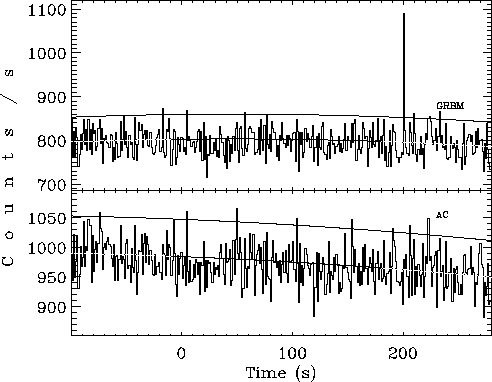
Figure:
Example of moving parabolic fit applied to estimate
the expected background counts for each bin. For a detailed description,
see the section about the late SWTCs. In this case, both the energy
bands of unit 1 are shown (OP 04421, May 1998). The +2 level
over the expected background is plotted.
level
over the expected background is plotted.
 |
The distributions shown in fig. ![[*]](crossref.png) describe how the
counts usually distribute around the correspondent mean values, which
are estimated
by means of a moving parabolic fit and are used for the GRB quest
(see next sections): an example of this
moving fit procedure is shown in fig. .
The deviations are expressed in terms of , taken as the square root
of the expected counts: each distribution, one for each energy band
of a given detector unit, has been fitted with a Gaussian.
describe how the
counts usually distribute around the correspondent mean values, which
are estimated
by means of a moving parabolic fit and are used for the GRB quest
(see next sections): an example of this
moving fit procedure is shown in fig. .
The deviations are expressed in terms of , taken as the square root
of the expected counts: each distribution, one for each energy band
of a given detector unit, has been fitted with a Gaussian.
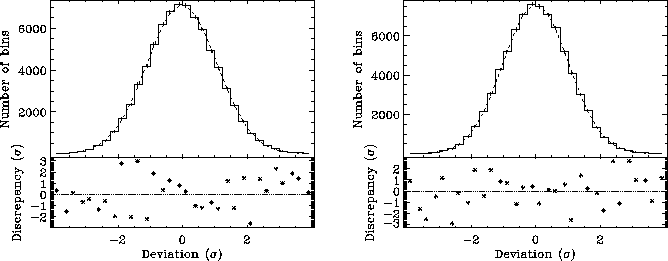
Figure:
Distributions of the counts (unit 1, GRBM band in the left and
AC band in the right panel, respectively) taken from
the OP 04421 (May 9-10, 1998), lasted  s. A moving parabolic
fit estimates the background counts expected for each time bin: here
the deviations of the measured counts from the corresponding
values are expressed in , calculated as the square root
of the expected counts. The s of the
best fitting normal distributions are consistent with the
poissonian s.
s. A moving parabolic
fit estimates the background counts expected for each time bin: here
the deviations of the measured counts from the corresponding
values are expressed in , calculated as the square root
of the expected counts. The s of the
best fitting normal distributions are consistent with the
poissonian s.
 |
While in the case of a typical OP the noise in the count distribution
is poissonian (
 ), there are also some rare
OPs, in which another non-poissonian component rises,
so that the standard deviation turns out to be significantly greater
than the poissonian. The case of OP 00915 shows
), there are also some rare
OPs, in which another non-poissonian component rises,
so that the standard deviation turns out to be significantly greater
than the poissonian. The case of OP 00915 shows
 for unit 1 (fig. ).
Nevertheless, this rare property of the counts statistics has been
observed only for the softer energy band, i.e. 40-700 keV: the AC
band noise always shows a poissonian nature.
The situation is summarized in table .
for unit 1 (fig. ).
Nevertheless, this rare property of the counts statistics has been
observed only for the softer energy band, i.e. 40-700 keV: the AC
band noise always shows a poissonian nature.
The situation is summarized in table .
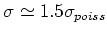
Figure:
Distributions of the counts (unit 1, GRBM band in the left and
AC band in the right panel, respectively) taken from
the OP 00915 (September 13, 1996), lasted 9500 s.
This is a rare OP, because it shows a non-poissonian
noise, since the standard deviation of its distribution
is  times the poissonian .
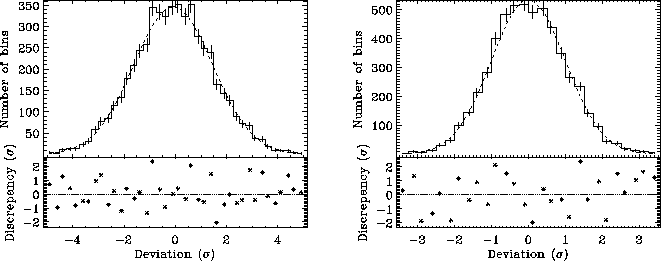 |
Table:
Count Distributions over the expected background
| OP |
Band + |
 |
|
 |
| |
Unit |
(
 ) ) |
(
) |
|
| 04421 |
GRBM1 |
 |
 |
0.084 |
| 04421 |
GRBM2 |
 |
 |
0.12 |
| 04421 |
GRBM3 |
 |
 |
0.14 |
| 04421 |
GRBM4 |
 |
 |
0.15 |
| 04421 |
AC1 |
 |
 |
0.077 |
| 04421 |
AC2 |
|
 |
0.015 |
| 04421 |
AC3 |
 |
 |
0.013 |
| 04421 |
AC4 |
 |
 |
0.011 |
| 00915 |
GRBM1 |
 |
 |
0.028 |
| 00915 |
GRBM2 |
 |
 |
0.041 |
| 00915 |
GRBM3 |
 |
 |
0.046 |
| 00915 |
GRBM4 |
 |
 |
0.044 |
| 00915 |
AC1 |
 |
 |
0.073 |
| 00915 |
AC2 |
 |
|
0.045 |
| 00915 |
AC3 |
 |
|
0.066 |
| 00915 |
AC4 |
 |
 |
0.034 |
Next: Spikes
Up: Medium and Short Time
Previous: Medium and Short Time
Contents
Cristiano Guidorzi
2003-07-31