![[*]](crossref.png) );
the remaining 18 have not been discovered automatically, owing to the
spectral softness of SGR bursts, below the HR threshold (eq. );
on the other side, this proves the effectiveness of the GRB search algorithms
in distinguishing the classical GRBs from SGRs (only 4 out of 22 bursts + 2
giant flares have been mistaken for GRBs by the automatic off-line quest).
The other 18 SGR bursts show no AC (
);
the remaining 18 have not been discovered automatically, owing to the
spectral softness of SGR bursts, below the HR threshold (eq. );
on the other side, this proves the effectiveness of the GRB search algorithms
in distinguishing the classical GRBs from SGRs (only 4 out of 22 bursts + 2
giant flares have been mistaken for GRBs by the automatic off-line quest).
The other 18 SGR bursts show no AC (
Finally, in addition to these 22 bursts, other two SGR burst candidates
have been detected: 980831, UT 22:52:40.71, attributed to SGR1900+14,
and 980618, UT 03:44:00.04, attributed to SGR1627-41; since they have
not been detected by Konus/WIND, they need confirmation.
Table reports all these SGR events as seen with the
GRBM; the two SGR burst candidates have been classified as ``uncertain''.
| SGR | Date | U.T. | Comments | |||
| name | ( |
( |
(s) | |||
| 1900+14 | 30 May 1998 | 23:27:35.28 | 216.5 | -3.8 | ||
| 1900+14 | 27 Aug 1998 | 10:22:15.69 | 240.8 | +47.5 | Giant Flare | |
| 1900+14 | 27 Aug 1998 | 11:06:57.39 | 240.8 | +47.5 | No Konus det. | |
| 1900+14 | 29 Aug 1998 | 10:16:32.30 | 152.9 | -24.5 | Intermediate Fl. | |
| 1900+14 | 29 Aug 1998 | 18:18:43.52 | 152.9 | -24.5 | ||
| 1900+14 | 31 Aug 1998 | 16:34:40.36 | 260.6 | +41.8 | No Konus det. | |
| 1900+14 | 31 Aug 1998 | 22:52:40.71 | 260.6 | +41.8 | Uncertain | |
| 1900+14 | 01 Sep 1998 | 17:06:27.06 | 114.7 | +36.4 | Unusual | |
| 1900+14 | 02 Sep 1998 | 07:23:50.13 | 114.7 | +36.4 | No Konus det. | |
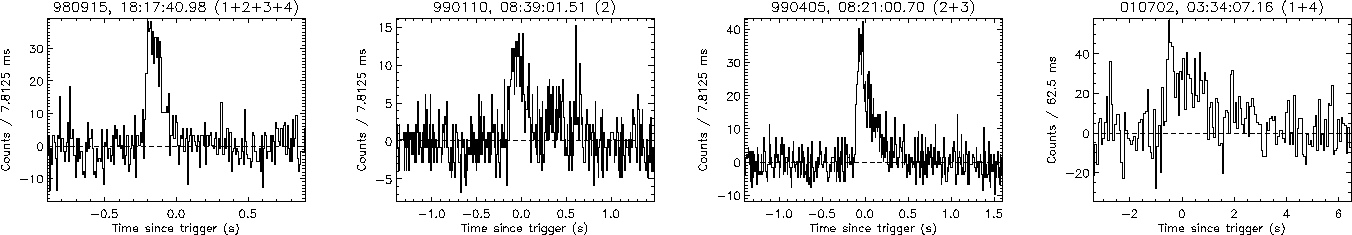
| 1900+14 | 15 Sep 1998 | 18:17:40.98 | 355.6 | +89.8 | NFI Observation | |
| 1900+14 | 10 Jan 1999 | 08:39:01.51 | 11.1 | -8.1 | ||
| 1900+14 | 05 Apr 1999 | 08:21:00.70 | 65.2 | +40.2 | Ulysses det.; hard | |
| 1900+14 | 18 Apr 2001 | 07:55:11.50 | 276.7 | +9.0 | Giant Flare; WFC1 det.! | |
| 1900+14 | 02 Jul 2001 | 03:34:07.16 | 207.8 | +19.1 | HETE-II det. | |
| 1627-41 | 17 Jun 1998 | 19:58:29.95 | 221.6 | +6.8 | ||
| 1627-41 | 17 Jun 1998 | 20:06:28.39 | 221.6 | +6.8 | ||
| 1627-41 | 17 Jun 1998 | 21:04:38.75 | 221.6 | +6.8 | ||
| 1627-41 | 17 Jun 1998 | 21:37:18.67 | 221.6 | +6.8 | ||
| 1627-41 | 17 Jun 1998 | 21:57:08.42 | 221.6 | +6.8 | ||
| 1627-41 | 18 Jun 1998 | 03:28:28.03 | 221.6 | +6.8 | ||
| 1627-41 | 18 Jun 1998 | 03:44:00.04 | 221.6 | +6.8 | Uncertain | |
| 1627-41 | 22 Jun 1998 | 13:29:54.94 | 140.8 | -18.0 | ||
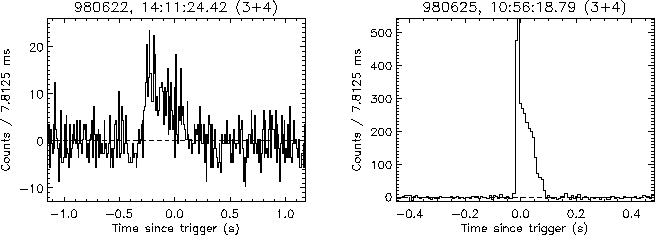
| 1627-41 | 22 Jun 1998 | 14:11:24.42 | 140.8 | -18.0 | ||
| 1627-41 | 25 Jun 1998 | 10:56:18.79 | 133.8 | +21.0 | ||
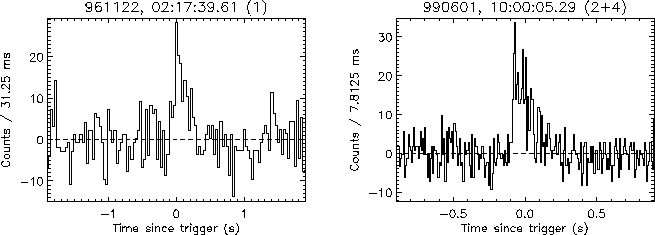
| 1806-20 | 22 Nov 1996 | 02:17:39.61 | 9.1 | +36.7 | ||
| 1806-20 | 01 Jun 1999 | 10:00:05.29 | 173.6 | +34.4 |
).
However, other bursts from SGR1900+14 look particularly hard, like in the
case of the burst occurred on January 10, 1999, (
Other bursts from SGR1900+14 have been detected by other experiments as well: this is the case of the burst occurred on July 2, 2001, first detected by HETE-II (Ricker et al., GCN 1078), and then confirmed by the GRBM detection (Montanari et al. , GCN 1081).
The SGR1900+14 burst occurred on August 29, 1998, i.e. two days after the
impressive giant flare of August 27, has been classified as ``intermediate''
burst in table , owing to its unusual properties;
this burst was also detected by BATSE and RXTE ([Ibrahim et al., 2001]).
One SGR1900+14 burst, occurred on September 15, 1998, was in the field of view of the NFI/BeppoSAX, while the April 2001 giant flare ([Guidorzi et al., 2001c], Guidorzi et al. , GCN 1041) was in the WFC1 field of view; the extraordinary brightness of this flare switched off the WFC by rate protection.
In figg.,
the time profiles of the short SGR1900+14
bursts are shown; the two giant flares are treated later on.
The energy band is 40-700 keV in all figures, since only in this range
HTR profiles are acquired; the numbers among brackets refer to the GRBM unit
numbers used for the light curves: e.g., ``(1+2+3+4)'' means that the
light curve shown is the sum of all GRBM units curves, and so on.
Similarly, figg. ,
show the time histories
of the bursts from SGR1627-41. In the case of SGR1806-20, fig.
shows both bursts detected with the GRBM; the light curve of 961122 belongs to the
GRBM unit 1, instead of unit 4, that is the brightest, because only the
HTR data of unit 1 are available within the current GRBM archive.