![[*]](crossref.png) the ), it
can be noted that in the GRBM case, the
bimodality distribution found by BATSE ([Kouveliotou et al., 1993,Fishman et al., 1994]) is less apparent, probably because of
a lack of short duration bursts (
the ), it
can be noted that in the GRBM case, the
bimodality distribution found by BATSE ([Kouveliotou et al., 1993,Fishman et al., 1994]) is less apparent, probably because of
a lack of short duration bursts (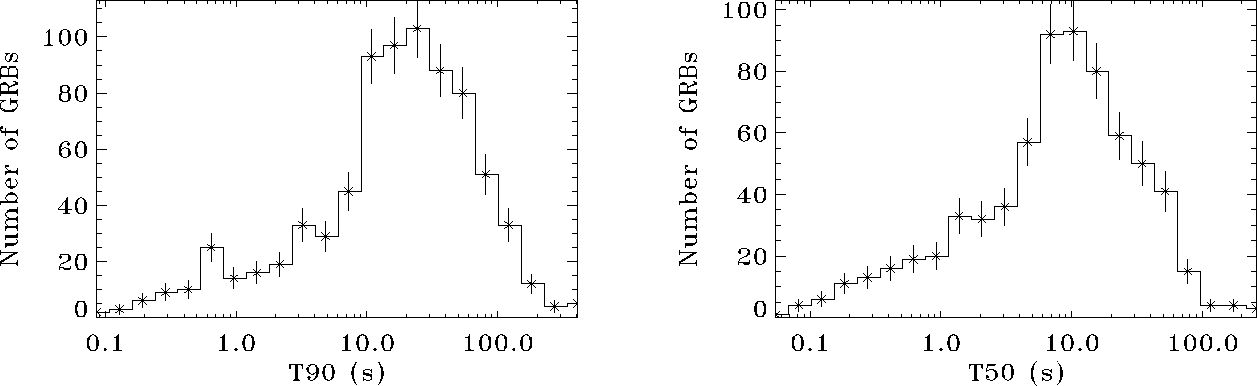 |
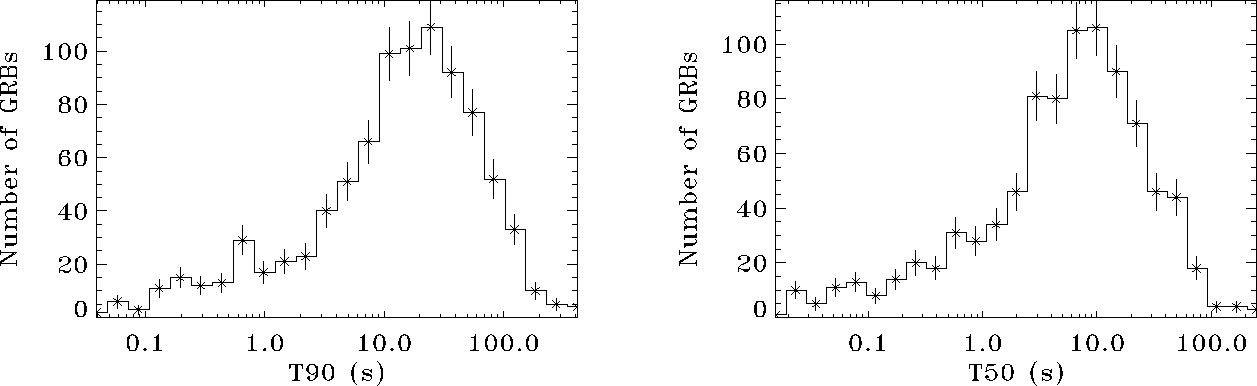
Like in the case of BATSE, the sample has been split into
the short (![]() s) and long (
s) and long (![]() s) burst classes,
with the following results: 124 short and 767 long GRBs,
corresponding to
s) burst classes,
with the following results: 124 short and 767 long GRBs,
corresponding to ![]() 14% and 86%, respectively.
For comparison,
in the case of BATSE bursts, the corresponding fractions were
14% and 86%, respectively.
For comparison,
in the case of BATSE bursts, the corresponding fractions were
![]() 26% and
26% and ![]() 74%, respectively ([Kouveliotou et al., 1993]).
To some extent, these values suggest the lack of short GRBs
in the GRBM catalog when compared to BATSE.
The logarithmic mean
74%, respectively ([Kouveliotou et al., 1993]).
To some extent, these values suggest the lack of short GRBs
in the GRBM catalog when compared to BATSE.
The logarithmic mean ![]() has turned out to be
has turned out to be ![]() s
s ![]() s
and
s
and ![]() s
s ![]() s for the short and long subset, respectively;
in the BATSE case,
s for the short and long subset, respectively;
in the BATSE case, ![]() s
s ![]() s and
s and ![]() s
s ![]() s had
been obtained, respectively ([Kouveliotou et al., 1993]).
In spite of the different energy bands
(40-700 keV for the GRBM,
s had
been obtained, respectively ([Kouveliotou et al., 1993]).
In spite of the different energy bands
(40-700 keV for the GRBM, ![]() 25 keV for BATSE), these values
look perfectly consistent each other.
25 keV for BATSE), these values
look perfectly consistent each other.
A possible explanation of the lack of short GRBs in the GRBM catalog
might be the following: out of ![]() 1/3 of the entire catalog, that did
not trigger the GRBM on-board logic (sec. ),
the duration could have been estimated only for the long bursts,
owing to the 1 s time resolution. Therefore, for several non-triggered short
bursts detected by the GRBM and recognized as true GRBs thanks to the
simultaneous detections by other experiments, the duration estimate
was not feasible. In addition, it is possible that a proportionally greater
fraction of off-line triggered short GRBs than long ones,
has been discarded or not classified as GRBs, afterwards,
since the lack of HTR data prevented from inspecting
their resolved time profiles.
1/3 of the entire catalog, that did
not trigger the GRBM on-board logic (sec. ),
the duration could have been estimated only for the long bursts,
owing to the 1 s time resolution. Therefore, for several non-triggered short
bursts detected by the GRBM and recognized as true GRBs thanks to the
simultaneous detections by other experiments, the duration estimate
was not feasible. In addition, it is possible that a proportionally greater
fraction of off-line triggered short GRBs than long ones,
has been discarded or not classified as GRBs, afterwards,
since the lack of HTR data prevented from inspecting
their resolved time profiles.
In other words, two sources of bias are thought to act against the short bursts detection and identification in the GRBM case: during the classification of the off-line triggered events, and within the duration estimation for the classified GRBs, for which HTR data are required only for the short bursts.
 |
Finally, it is possible to show that, when the on-board short integration
time (sec. ) is 1 or 2 s, the GRBM on-board trigger efficiency
is worse for short than for long bursts: let us suppose that the efficiency
does not significantly change for short and long bursts; then,
since the short GRB population, contributing to the duration distribution,
includes only on-board triggered events,
if one takes into account the energy-averaged on-board trigger efficiency
![]() estimated in eq. ,
estimated in eq. ,
![]() (
(![]() )%, the number of short bursts that should have been
detected raises to
)%, the number of short bursts that should have been
detected raises to
![]() , i.e. other 70 short bursts
that did not trigger the on-board logic.
Then, the fraction of short burst would be
, i.e. other 70 short bursts
that did not trigger the on-board logic.
Then, the fraction of short burst would be
![]() %.
Nevertheless, since the BATSE corresponding fraction amounts to
%.
Nevertheless, since the BATSE corresponding fraction amounts to ![]() 26%,
this strongly suggests that the true GRBM on-board trigger efficiency
is lower for short bursts than its average value of (
26%,
this strongly suggests that the true GRBM on-board trigger efficiency
is lower for short bursts than its average value of (![]() )%, found
for the overall catalog (sec. ).
)%, found
for the overall catalog (sec. ).
Moreover, the same distributions have been obtained, by excluding all
the GRBs, whose duration estimates were not at least 3![]() significant;
this selection reduced the sample of
significant;
this selection reduced the sample of ![]() durations from 891 to 777,
and the
durations from 891 to 777,
and the ![]() durations from 891 down to 689; the new duration
distributions are shown in fig. .
In this case, there are 82 (11%) short and 695 (89%) long GRBs: this
shows that the short GRBs are known with worse accuracy than the long
ones, on average; the logarithmic mean
durations from 891 down to 689; the new duration
distributions are shown in fig. .
In this case, there are 82 (11%) short and 695 (89%) long GRBs: this
shows that the short GRBs are known with worse accuracy than the long
ones, on average; the logarithmic mean ![]() is
is ![]() s
s ![]() s
and
s
and ![]() s
s ![]() s for the short and long subset, respectively.
s for the short and long subset, respectively.