![[*]](crossref.png) ):
because of this, a rigorous classification
based on the time profile shape is not feasible.
Nevertheless, many bursts can be classified into some kinds
based on rough criteria ([Ryde 1999], [Ryde & Svensson, 2001]):
one such class collects the so-called
FREDs, acronymous of Fast Rise Exponential Decay, for
their typical single pulse profile, whose rise time is much shorter
than the decay time (e.g. GRB010721, fig. ).
Then, we can distinguish between the multi-peak bursts and
those with only one or two peaks; the GRBs with no apparent
signal among next pulses (GRB971110, GRB000115, GRB990913,
fig. ) from those which do not show any ``gaps''
in the overall profile.
No rule about the brightness of each pulse: the first pulses
may be brighter (GRB990913) or fainter (GRB000115)
than the following pulses.
In some cases, a repetitive pattern seems to modulate the
structure of the burst profile (GRB970831).
Some bursts show time variability on ms timescales (GRB010412).
):
because of this, a rigorous classification
based on the time profile shape is not feasible.
Nevertheless, many bursts can be classified into some kinds
based on rough criteria ([Ryde 1999], [Ryde & Svensson, 2001]):
one such class collects the so-called
FREDs, acronymous of Fast Rise Exponential Decay, for
their typical single pulse profile, whose rise time is much shorter
than the decay time (e.g. GRB010721, fig. ).
Then, we can distinguish between the multi-peak bursts and
those with only one or two peaks; the GRBs with no apparent
signal among next pulses (GRB971110, GRB000115, GRB990913,
fig. ) from those which do not show any ``gaps''
in the overall profile.
No rule about the brightness of each pulse: the first pulses
may be brighter (GRB990913) or fainter (GRB000115)
than the following pulses.
In some cases, a repetitive pattern seems to modulate the
structure of the burst profile (GRB970831).
Some bursts show time variability on ms timescales (GRB010412).
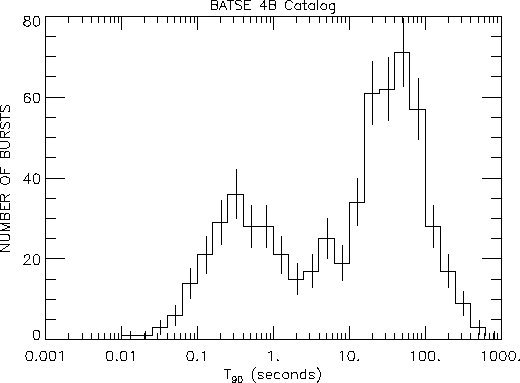
As to the time duration, from the BATSE sample there is some evidence
for the existence of two classes: in fact, if the duration is
evaluated in terms of ![]() , which is calculated by taking
the interval going from the time at which the total fluence
is at 5% to the time at which it is at 95% of the overall burst
fluence, then it comes out that the
, which is calculated by taking
the interval going from the time at which the total fluence
is at 5% to the time at which it is at 95% of the overall burst
fluence, then it comes out that the ![]() distribution
(fig. ) is well
described by a bimodal function, with the two peaks around
distribution
(fig. ) is well
described by a bimodal function, with the two peaks around ![]() s
and
s
and ![]() s, respectively, and a minimum around 2 s
([Kouveliotou et al., 1993]).
According to some papers ([Mukherjee et al., 1998,Horváth 1998,Balastegui et al., 2001]),
a third intermediate class of GRBs might exist as well.
s, respectively, and a minimum around 2 s
([Kouveliotou et al., 1993]).
According to some papers ([Mukherjee et al., 1998,Horváth 1998,Balastegui et al., 2001]),
a third intermediate class of GRBs might exist as well.
 |
.
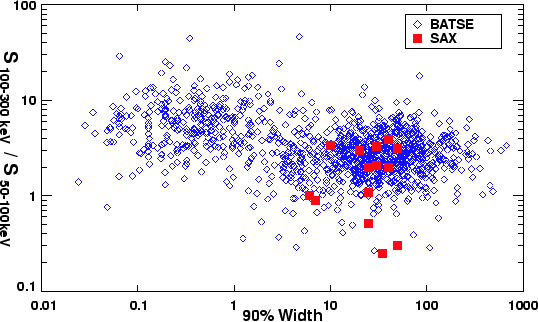
According to [Cline et al., 1999], the short bursts seem to show
more symmetrical profiles than the long ones.
In particular, in fig.
there is some evidence for a correlation betweeen
spectral hardnesses and durations; the spectral hardness ratio
is defined as the ratio
between the BATSE channel 3 (100-300 keV) and channel 2
(50-100 keV) counts, while the duration is measured in terms of
![]() .
.
 |
Another temporal property of GRBs which gives an insight into the progenitor nature is the time variability, which is significant on ms timescales ([Walker et al., 2000]): this suggests that the source should be compact, like neutron stars or black holes. Moreover, since at least some GRBs come from cosmological distances, there is a connected time dilation effect that should be taken into account; this time dilation also works differently, depending on the energy band.
An interesting property has been discovered by [Beloborodov, Stern & Svensson, 1998],
from the study of the power density spectra (PDSs): according
to this analysis, the average PDS seems to follow a power law with
index -5/3 over almost two decades, with a break around ![]() 2 Hz;
this property seems to be connected with the presence of developed
turbulence. Some works ([Panaitescu et al., 1999], [Spada et al., 2000])
have tried to simulate bursts arising from
internal shocks in relativistic winds (see the Fireball Model, next
sections), in order to find out the most sensitive factors, that
are consistent with the observed power law index -5/3;
nevertheless, the interpretation of this feature is debated
([Chang & Yi, 2000]).
2 Hz;
this property seems to be connected with the presence of developed
turbulence. Some works ([Panaitescu et al., 1999], [Spada et al., 2000])
have tried to simulate bursts arising from
internal shocks in relativistic winds (see the Fireball Model, next
sections), in order to find out the most sensitive factors, that
are consistent with the observed power law index -5/3;
nevertheless, the interpretation of this feature is debated
([Chang & Yi, 2000]).