Event Building Algorithm
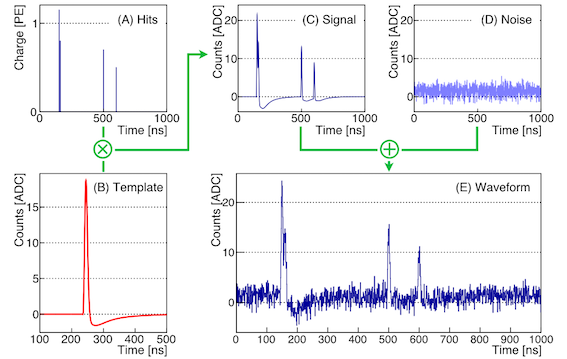
Figure 5: Illustration of the waveform building procedure. Panel C shows the background free waveform resulting from the convolution of the hit distribution (Panel A) with the single photoelectron waveform (Panel B). The realistic synthetic waveform shown in Panel E is obtained summing a non Gaussian noise (Panel D) to the background free waveform
In order to validate the FDA and CRA is given an algorithm used to produce the input files to be processed by the analysis algorithm.
Input of the Synthetic Waveform Production Algorithm
The algorithm use the following equation [1] to parametrize the sPE spectrum
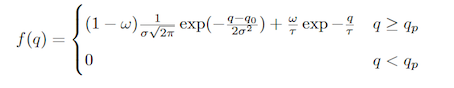
Equation 1
Where:
| Parameter | Adopted values | Variable in the code |
|---|---|---|
| q0 | q0=1 | q0 |
| qp=cutoff of the right pedestial peak | qp=0.5 | qp |
| σ = standard deviation | σ = 0.30 | sigmaq |
| ω = weight parameter | ω =0.2 | w |
| τ = decay constant | τ = 0.5 | tq |
Table 4: List of the parameters used to simulate the sPE spectrum
These values can be changed in the EventsCreator.cc file.
To parametrize the sPE template it has been use the following equations [1]

Equation 2
Where:
| Parameter | Adopted values | Variable in the code |
|---|---|---|
| U0peak | U0peak=20 ADC | U |
| σ | σ = 0.15 | sigma |
| τ | τ = 30 ns | tau |
Table 5: List of the parameters used to simulate the peak of sPE shape
| Parameter | Adopted values | Variable in the code |
|---|---|---|
| U1_os | U1_os=-1.2 ADC | U1_os |
| σ1 | σ1 = 55 | sigma1_os |
| t1 | t1 = -4 ns | t1_os |
| Parameter | Adopted values | Variable in the code |
|---|---|---|
| U2_os | U2_os=-2.8 ADC | U1_os |
| t2 | t2 = 50 ns | t2_os_0 |
| t3 | t3 = 10 ns | t2_os_1 |
| τ2 | τ = 80 ns | tau2_os |
Table 6-7: List of the parameters used to simulate the overshoot of sPE shape
The noise is modelled with a Gaussian noise parametrized by
| Parameter | Adopted values | Variable in the code |
|---|---|---|
| μ = the average of the Gaussian Distribution | μ = 1.5 | mu_noise_wave |
| σ = the standard deviation of the Gaussian Distribution | σ = 1 | sigma_noise_wave |
| A = the mean amplitude of the Noise | A = 1 ADC | A |
Table 8: List of the parameters used to simulate the noise
We simulate also non-Gaussian noise due to the external and internal electronics by adding specific frequencies to the Gaussian Noise spectrum parametrized as follows
1) n_peak is the number of the specific frequencies
2) They will have, by default, a frequency in the range [50 MHz; 150MHz] and each one will produce a noise with an height between [0 ADC, 1 ADC].
All the parameter can be varied modifying the config file situated in ./conf/config_evt.txt
| # num_event = 10000 |
| # num_max_hit = 16 |
| # n_peak = 20 |
| # nSamples = 1000 |
| # U = 20 |
| # tau = 30 |
| # sigma = 0.15 |
| # U1_os = -1.2 |
| # t1_os = -4 |
| # sigma1_os = 55 |
| # U2_os = -2.8 |
| # tau_2_os = 80 |
| # t2_os_0 = 50 |
| # t2_os_1 = 10 |
| # deltax = 215 |
| # mu_noise = 1.5 |
| # sigma_noise = 1 |
Where:
| - # num_event: is the number of events to be analyzed |
| - # num_max_hit: is he maximum number of hits (used for build the graph) |
| - # nSamples: is the number of sampling point of each waveform |
[1] S. Jetter et al, Chinese Physics C 36, 93-98 (2012)
Output of the Synthetic Waveform Production Algorithm
The Output of the Synthetic Waveform Production Algorithm are two *.root files called LED_unblinded.root and physics_unblinded.root containing the tree to be analysed by the Calibration Algorithm and by the Charge Reconstruction Algorithm respectively.