Natural radioactivity mapping provides the opportunity to represent, through the thematic maps, the data coming from in-situ gamma-ray spectroscopy surveys. Distribution maps of K, U and Th abundances as well as of the specific total activity in Bq/kg can be produced on the basis of gamma-ray measurements. Adopting appropriate statistical and geostatistical tools, the radioactivity content is represented through the use of colors and/or symbols.
Mapping the natural radioactivity
Geostatistical analysis: from measurements to a map
Geostatistics is the field of science that provides the tools for estimating the value of a spatial variable in the locations where this variable is not measured: in other words, geostatistical methods make predictions, as much as possible, on a continuous model of a spatial variable starting from a finite number of samples. Geostatistical algorithms are incorporated in geographic information systems (GIS) that permit to perform sophisticated spatial interpolation process.
Generally, every geostatistic method estimates the value of the variable in unknown locations Z*(x0) as a weighted sum of the measured values Zi(xi), assigning a weight to each of them.
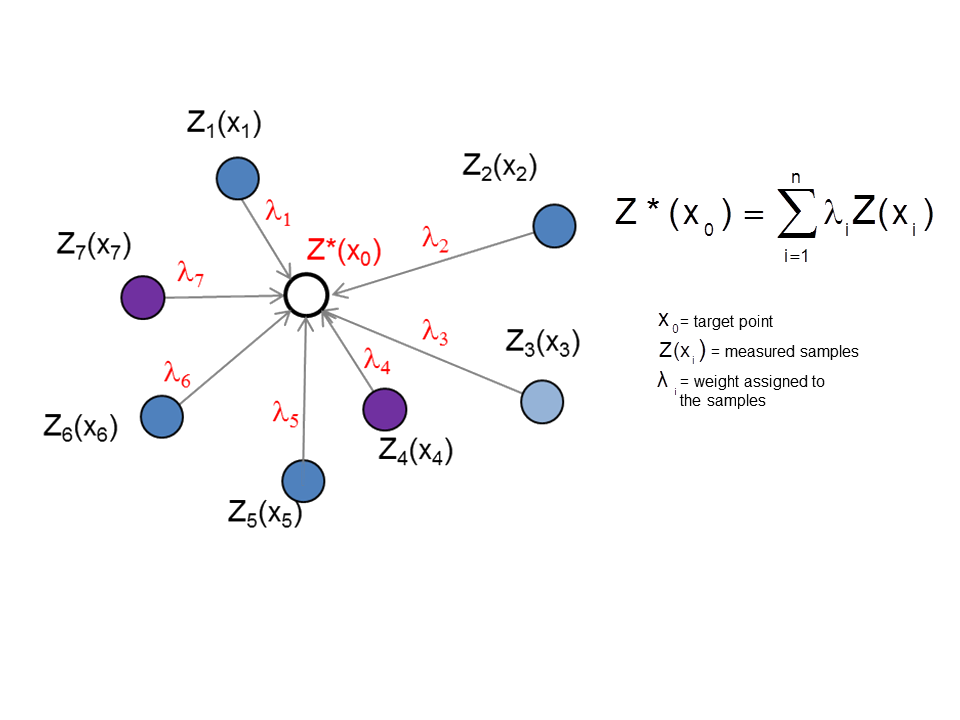
The different spatial interpolation methods, from the simplest to the more complex ones, differ on the way the weights are assigned. A first order classification individuate two groups of estimators:
- Deterministic methods: the values of the input variables are fixed and the associated uncertainty is not taken into account. The spatial interpolation is generally based on mathematical function such as linear interpolation, polynomial functions or inverse functions of distance. Triangulation, Natural Neighbor interpolation and Inverse functions of distance are common deterministic methods.
- Stochastic methods: the spatial continuity of the input data is taken into account and the results are provided in terms of probability. For each point in space there's not just one value but a whole set of values according to some probability distribution. If it's known what that distribution might be, it is possible to estimate values at unrecorded location from data in the neighborhood and associate errors to estimates. The Kriging, a generic term embracing different kinds of kriging, is the most common stochastic method.
A multivariate approach: the Collocated CoKriging
In many cases, the environmental datasets are multivariate datasets: this means that two or more variables are available and can be studied simultaneously if they have a similar statistical behavior, i.e. if they are correlated. Moreover, one variable may be spatially related with another in the sense that its values at places are correlated with the values of the other variable. Taking advantage of the correlation existing between two or more variables, the role of a multivariate geostatiscal method is to improve the estimation of one variable on the base of a another variable. The CoKriging is the natural extension of the kriging in presence of a multivariate dataset.
However, sometimes the investigated variables are sampled by different supports, measured on different scales, and organized in different sampling schemes, which makes the realization of a single optimized prediction more difficult. In this framework the Collocated CoKriging (CCoK) technique was recently introduced for dealing with the primary and secondary variables when the variable of interest has been sampled at a few locations and the secondary variable has been extensively sampled. In the field of radioactivity mapping, applying the CCoK with the use of a continue information included in a geological map as secondary variable has big potentialities.
The natural radioactivity map of the Campus
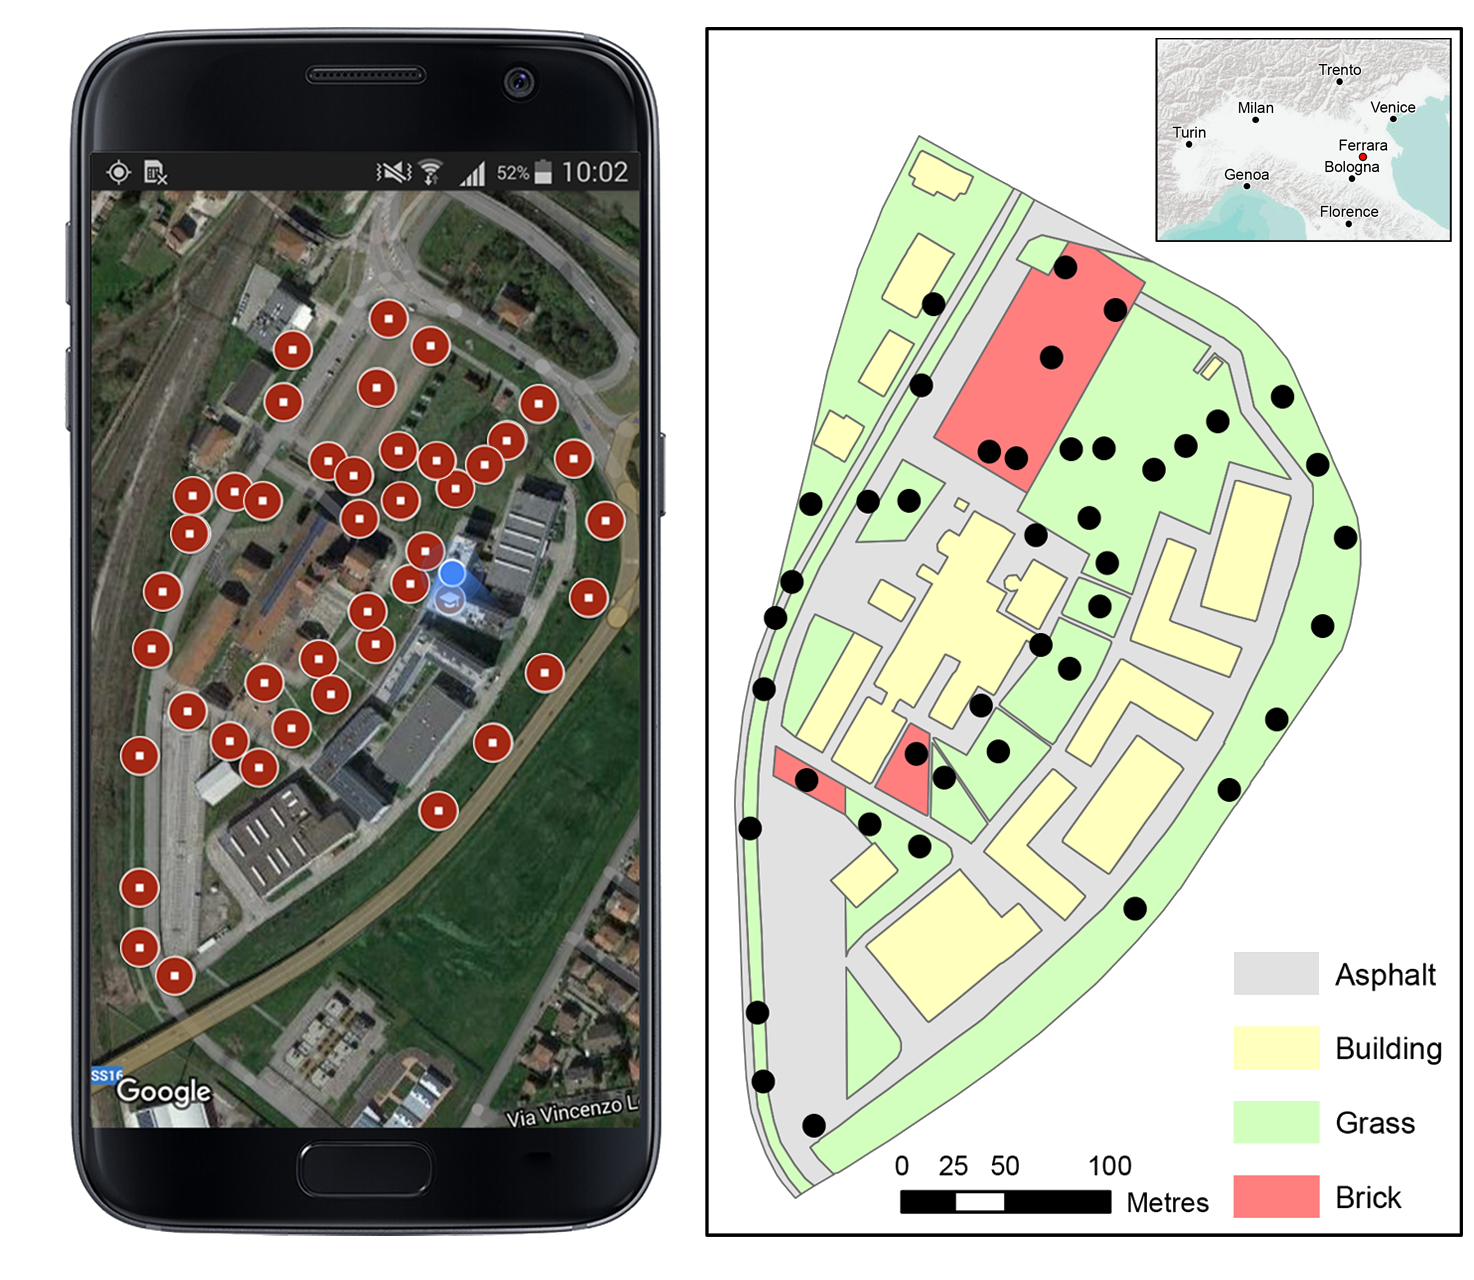
The CCoK was applied in a non-conventional way during the laboratories activities of the Maymester "Concepts in Nuclear and Radiation Engineering" with the aim to realize the Natural radioactivity map of the Campus of the University of Ferrara (Italy). During the in-situ survey, the students used portable NaI detector to perform gamma-ray spectroscopy measurements on different types of ground coverage, i.e. asphalt, grass and brick. In order to have an homogenous covering of the surveyed area, the number and location of the measurements points was previously planned and loaded in the Google Maps app of a smartphone.
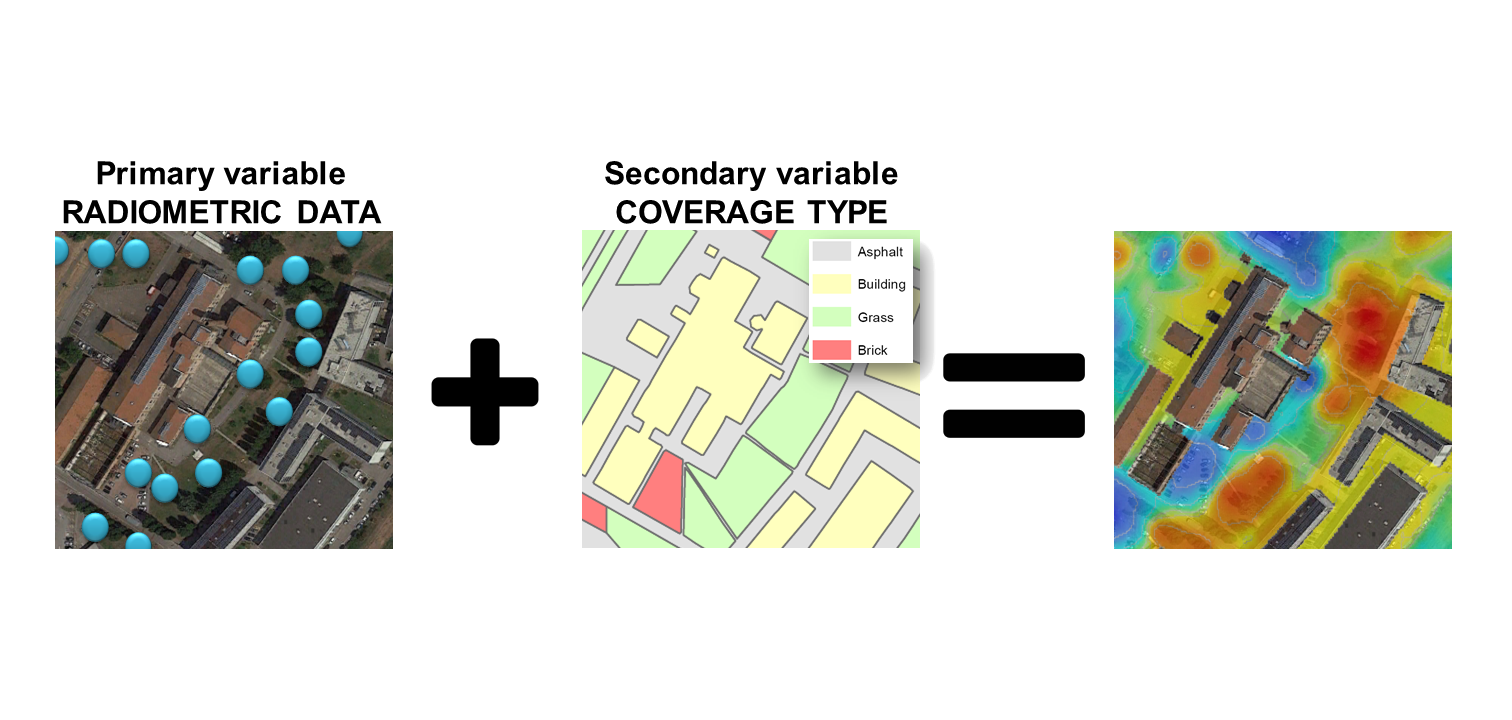
The CCoK was applied considering the total specific activity as the under-sampled primary variable and the type of ground coverage as secondary variable known in each location. A continuous grid was created for the investigated area and for each type of coverage a pseudo-random value is assigned in order to obtain a normal distribution. The radiometric measurements are spatially conjoined to the coverage grid and so, a multivariate point dataset is obtained. The spatial variability is studied by computing and modeling the cross-variogram of the total specific activity and the coverage type.
Downloads
Map of the total specific activity of the campus obtained from the spatial interpolation of the in situ gamma-ray measurements:
KML for visualizing the measurement points of the natural radioactivity in the campus in Google Earth: