![[*]](crossref.png) ), the observed dipole and
quadrupole relative to the galaxy are perfectly consistent with
null values, i.e. with an isotropic distribution; this
property clearly supports an extragalactic origin or, at least,
from an extended dark halo surrounding our Galaxy;
to distinguish between these two possible models, two kind
of analysis have been performed: either to test the angular
isotropy with high precision ([Briggs et al., 1996], [Hakkila et al., 1994],
[Tegmark et al., 1996b]), or to search for a possible population
of GRB sources around M31 ([Klose, 1995], [Lamb, 1995]);
while the latter did not find any evidence, the former over
the years set severe constraints, thus making unlikely a
galactic origin of GRBs; these constraints regarded burst
repetition as well ([Meegan et al., 1995], [Tegmark et al., 1996a]).
), the observed dipole and
quadrupole relative to the galaxy are perfectly consistent with
null values, i.e. with an isotropic distribution; this
property clearly supports an extragalactic origin or, at least,
from an extended dark halo surrounding our Galaxy;
to distinguish between these two possible models, two kind
of analysis have been performed: either to test the angular
isotropy with high precision ([Briggs et al., 1996], [Hakkila et al., 1994],
[Tegmark et al., 1996b]), or to search for a possible population
of GRB sources around M31 ([Klose, 1995], [Lamb, 1995]);
while the latter did not find any evidence, the former over
the years set severe constraints, thus making unlikely a
galactic origin of GRBs; these constraints regarded burst
repetition as well ([Meegan et al., 1995], [Tegmark et al., 1996a]).
The distribution of sources in space shows a significant
deviation from the homogeneous flat space distribution
([Pendleton et al., 1995]), but consistent with a cosmological
distribution. Furthermore, the short duration burst distribution
looks consistent with a homogeneous Euclidean distribution
([Katz & Canel, 1996]).
On this subject, according to a standard candle model within
an Euclidean geometry space,
let us suppose that all bursts have the same luminosity ![]() ;
let
;
let ![]() be the peak flux,
be the peak flux, ![]() the volume of the sphere, whose radius
the volume of the sphere, whose radius
![]() is the distance to the GRB source; then, in connection with
the minimum detectable flux
is the distance to the GRB source; then, in connection with
the minimum detectable flux ![]() for a fixed detector,
there is the maximum volume:
for a fixed detector,
there is the maximum volume: ![]() , whose radius
, whose radius ![]() can be obtained from the following:
can be obtained from the following:
![]() .
Under these assumptions, the following relationship between
the relative volume and the relative peak flux follows:
.
Under these assumptions, the following relationship between
the relative volume and the relative peak flux follows:
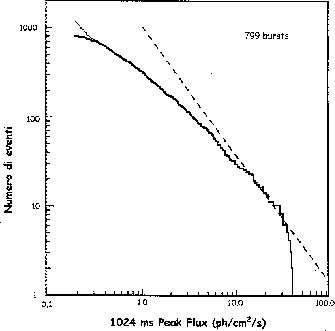
is suitable for testing
the spatial distribution of a GRB set: for a homogeneous distribution
within an Euclidean space, the , from fig. ,
obtained from a sample of BATSE bursts, it comes out that the spatial
distribution cannot be consistent with the homogeneous case, since there are
fewer faint bursts than predicted by this case.