In order to remove this duration dependence on the background rate,
and also to compare the GRBM catalog results with those derived from
BATSE ([Paciesas et al., 1999]), the duration estimates are computed in terms
of ![]() and
and ![]() ([Kouveliotou et al., 1993]), expressing the
durations of the time intervals, lasting from the times corresponding
from 5% to 95% and from the 25% to 75% of the total counts,
respectively.
([Kouveliotou et al., 1993]), expressing the
durations of the time intervals, lasting from the times corresponding
from 5% to 95% and from the 25% to 75% of the total counts,
respectively.
In particular, the technique described by [Koshut et al., 1996], has been adapted to the GRBM data, only for the 40-700 keV (GRBM) energy band; this choice was driven by the need to measure the durations also for the short bursts, for which the HTR data are required, and these data are available only for the GRBM band.
 |
In order to choose the best GRBM light curve for estimating the burst
duration, five SNRs are taken into account: these refer to the four
total counts, one for each GRBM unit, while the fifth refers to the
sum of the two brightest units.
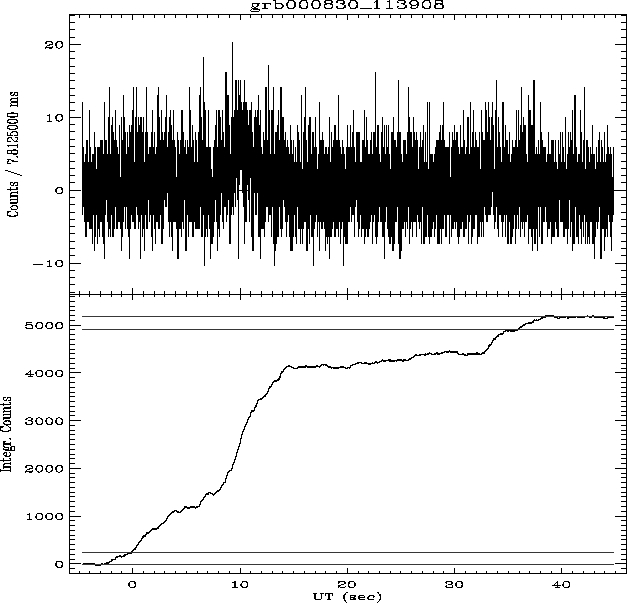
In fig. ![[*]](crossref.png) the example of GRB000830, already
considered within the previous sections, is shown: in this case,
from the 1 s light curves, it comes out that the entire GRB is covered
by the HTR data, since this particular burst has triggered the on-board
logic. In such cases, the use of the HTR data instead of the 1 s data
allows a better estimate of the
the example of GRB000830, already
considered within the previous sections, is shown: in this case,
from the 1 s light curves, it comes out that the entire GRB is covered
by the HTR data, since this particular burst has triggered the on-board
logic. In such cases, the use of the HTR data instead of the 1 s data
allows a better estimate of the
![]() required
for calculating
required
for calculating ![]() and
and ![]() .
The technique adopted applies to the integral background subtracted
counts as a function of time: this function is fitted with a constant
in two intervals, one before and one after the burst: the difference
in counts between these levels correspond to the total counts, and
.
The technique adopted applies to the integral background subtracted
counts as a function of time: this function is fitted with a constant
in two intervals, one before and one after the burst: the difference
in counts between these levels correspond to the total counts, and
![]() occur when this function is at
5%, 25%, 75%, 95% of the total fluence.
In the example of GRB000830 (fig. ), the
sum GRBM 3+2 has the best SNR, and it has been used for estimating
the
occur when this function is at
5%, 25%, 75%, 95% of the total fluence.
In the example of GRB000830 (fig. ), the
sum GRBM 3+2 has the best SNR, and it has been used for estimating
the ![]() and
and ![]() , that have found to be
, that have found to be ![]() s
and
s
and ![]() s, respectively.
s, respectively.