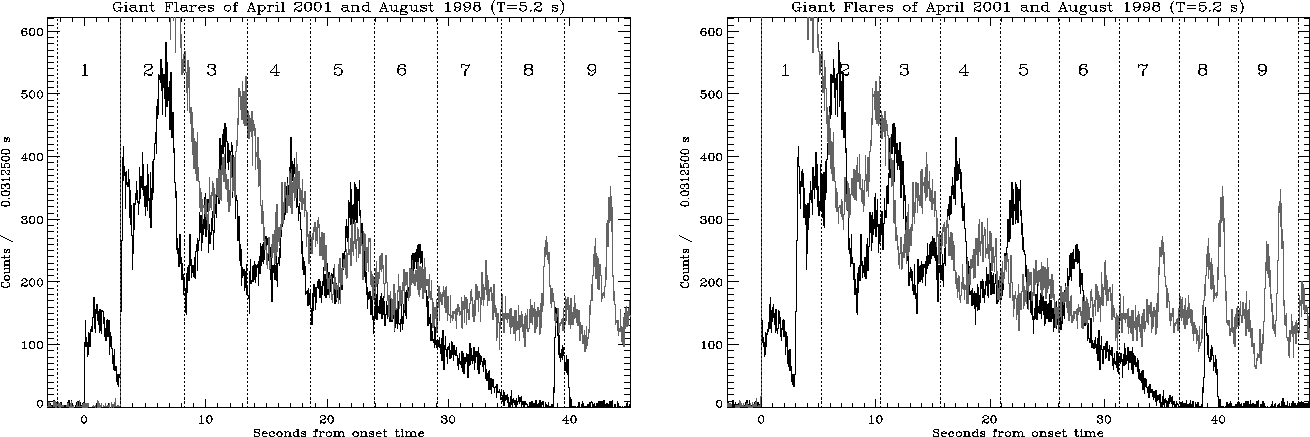
![[*]](crossref.png) the two light curves have been superposed with two different temporal offsets:
assuming as zero phase either the steepest rises, or the onset times.
In both cases, the light curves has been sliced up according to the
limits to the first
0-45 s, because this is the duration of the shorter 2001 flare, and it shows
interesting features in both flares.
the two light curves have been superposed with two different temporal offsets:
assuming as zero phase either the steepest rises, or the onset times.
In both cases, the light curves has been sliced up according to the
limits to the first
0-45 s, because this is the duration of the shorter 2001 flare, and it shows
interesting features in both flares.
The first apparent difference is that, while in the 1998 case the onset coincides
with the brightest pulse onset, it is not the same for the 2001 flare; another outstanding
difference is that, after the first 40-45 s, the 1998 continuum signal looks to become
stable (actually it starts decaying slowly), while the 2001 signal disappears
quite suddendly, after the last burst (![]() s).
s).
Let us split the 1998 case into three intervals: the initial spike
(![]() first 10 s), the temporary modulation interval (from
first 10 s), the temporary modulation interval (from ![]()
![]() s to
s to ![]() s)
in which the continuum component is not quasi-steady yet and the modulation is not
apparent yet as in the next interval, lasting from
s)
in which the continuum component is not quasi-steady yet and the modulation is not
apparent yet as in the next interval, lasting from ![]()
![]() s to the
end, at
s to the
end, at ![]() 300 s, where it is dominated by a strong
300 s, where it is dominated by a strong ![]() s modulation.
s modulation.
In spite of the very different time durations of the two flares, and, above all, of the different peak fluxes and energy released, the second interval of the 1998 flare shows similar duration and average intensity to the 2001 flare: when this temporary phase ends, leaving the strongly modulated slow decay to dominate in the 1998 case, at the same point the 2001 flare ends, or, at least, it cannot be detected by the GRBM any longer.
Finally, there are also some periodic pulses from the two flares, which overlap,
depending on the offset choice (fig. ).
A full discussion and an attempt to interpret all these features is among the
topics treated in the forthcoming work by Guidorzi et al., 2002.
 |