


Next: Direction Distribution
Up: The GRB Catalog
Previous: HR-Duration Correlation
Contents
In section ![[*]](crossref.png) the effectiveness of the automatic
threshold (set to
the effectiveness of the automatic
threshold (set to  ) on the HR for rejecting false GRBs has been
emphasized.
In fig. the HR distribution of the
891 GRBs, used for the duration distribution discussed in the
previous section, is shown.
) on the HR for rejecting false GRBs has been
emphasized.
In fig. the HR distribution of the
891 GRBs, used for the duration distribution discussed in the
previous section, is shown.
Figure:
HR Distribution of 891 GRBs from the GRBM catalog.
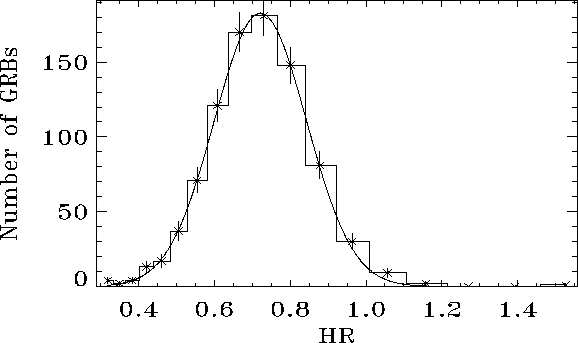 |
The distribution is satisfactorily fitted with a normal distribution
plus a constant function (eq. );
the gaussian parameters so found are the following:
 (center),
 (sigma), with a
 .
From fig. it is apparent that the HR condition
(eq. ) does not reject any true cosmic GRBs.
.
From fig. it is apparent that the HR condition
(eq. ) does not reject any true cosmic GRBs.
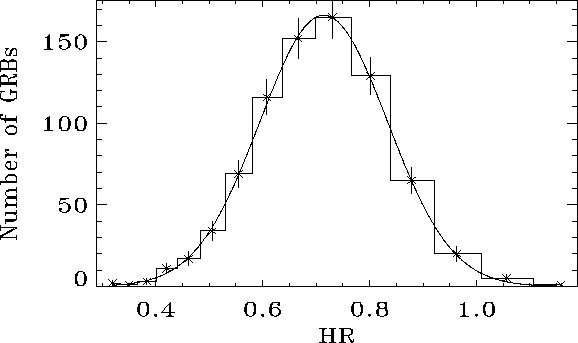
The HR distribution for the only GRBs, whose HR is at least 3 significant, has been extracted and shown in fig. .
This subset includes 790 GRBs and the derived distribution is well
fitted with a normal distribution as well; the parameters gaussian
parameters are
significant, has been extracted and shown in fig. .
This subset includes 790 GRBs and the derived distribution is well
fitted with a normal distribution as well; the parameters gaussian
parameters are  (center),
(sigma), with a
(center),
(sigma), with a
 (eq. ).
Figure:
HR Distribution of 790 GRBs from the GRBM catalog, with
at least 3 significant HRs.
 |
It is worth mentioning: the width of the HR distribution
somehow depends on the GRBM response as a function of the GRB arrival
direction.
In order to reduce this effect,
the HRs used are the weighted averages of the
HRs of the single GRBM units. It might be possible that the HR
distribution deconvolved by the GRBM response function
could be even narrower.
In table the parameters of the best fits of
the distributions are reported.
![\begin{displaymath}
\frac{dN_{fit}}{d(HR)} \ = \ Const. + N_0 \cdot \exp{\Big [-\frac{(HR - HR_0)^2}{2\sigma_{HR}^2}\Big ]}
\end{displaymath}](img665.png) |
(43) |
Table:
Parameters of the Gaussian + Constant functions, best fitting
the HR distribution.
| GRB set |
Center |
Sigma |
Const. |
Normaliz. |
Red. |
| |
( ) ) |
 |
|
 |
 |
| All (891) |
0.72 |
0.12 |
1.48 |
182.7 |
0.66 |
 (790) (790) |
0.71 |
0.12 |
0.63 |
166.3 |
0.29 |
Next: Direction Distribution
Up: The GRB Catalog
Previous: HR-Duration Correlation
Contents
Cristiano Guidorzi
2003-07-31