


Next: Spikes' Remotion
Up: Background Fit
Previous: Background Fit
Contents
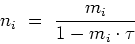
The expression ![[*]](crossref.png) gives the dead time correction
of the GRBM light curves, taking into account the GBRM
ratemeter and the fixed dead time
gives the dead time correction
of the GRBM light curves, taking into account the GBRM
ratemeter and the fixed dead time
 s (table ):
 |
(40) |
In the above expression,  and
and  are
the measured and the dead time corrected count rates for the
are
the measured and the dead time corrected count rates for the  -th bin,
respectively.
This correction becomes relevant when is comparable
with
-th bin,
respectively.
This correction becomes relevant when is comparable
with  .
.
Table:
Some Ratemeter Dead Time Corrections
| (c/s) |
(c/s) |
Correction (%) |
| 6000.0 |
6147.5 |
2.5 |
| 12000.0 |
12605.0 |
5.0 |
| 18000.0 |
19396.6 |
7.8 |
| 24000.0 |
26548.7 |
10.6 |
| 30000.0 |
34090.9 |
13.6 |
| 36000.0 |
42056.1 |
16.8 |
| 42000.0 |
50480.8 |
20.2 |
| 48000.0 |
59405.9 |
23.8 |
| 54000.0 |
68877.6 |
27.6 |
| 60000.0 |
78947.4 |
31.6 |
In table the correction factor
vs. the measured count rate is reported: clearly, a correction of
the order of  10% occurs for count rates of at least
few
10% occurs for count rates of at least
few  c/s, i.e. for the brightest bursts.
After dead time correction, the background has been modelled by means of a
least-square polynomial fit around the burst, excluding the central
interval including the burst itself; the time boundaries of the interval
used for fitting vary from case to case, mainly depending on the burst
duration and time profile.
A 2nd degree polynomial sufficed for nearly all the GRBs, except a
few cases, in which higher degree polynomials are needed to account
for delicate background variations.
The summed light curves of the two brightest GRBM units, one for
each energy band, are taken into account as well.
In fig. the example of background fit
applied to the light curves of the GRB000830,
UT 11:39:08, is shown.
Figure:
Background Fit for GRB000830, UT 11:39:08. From top to bottom:
GRBM1, ..., GRBM4, AC1, ..., AC4.
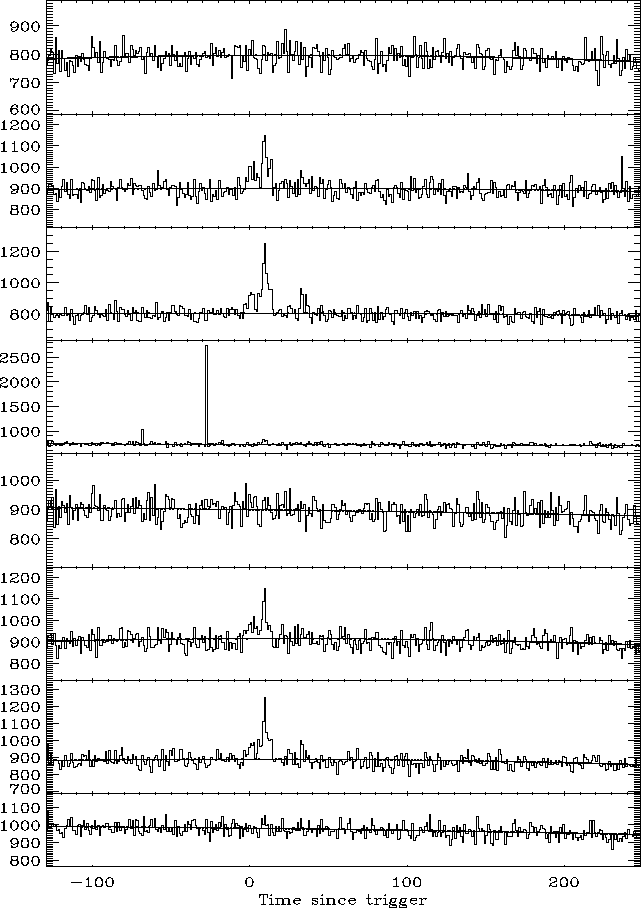 |
Once the background level has been determined from the fit, a set
of 10 reduced  is reported (two light curves -one for each
energy band- for each GRBM units plus other two, concerning the
summed light curves of the two brightest GRBM units),
to evaluate the goodness of the fit.
In the case of GRB000830, the GRBM units 3 and 2 were the brightest
units; the 10 are the following:
is reported (two light curves -one for each
energy band- for each GRBM units plus other two, concerning the
summed light curves of the two brightest GRBM units),
to evaluate the goodness of the fit.
In the case of GRB000830, the GRBM units 3 and 2 were the brightest
units; the 10 are the following:
 for the GRBM1, ..., GRBM4, GRBM3+2,
and
for the GRBM1, ..., GRBM4, GRBM3+2,
and
 for the AC1,..., AC4, AC3+2,
respectively.
for the AC1,..., AC4, AC3+2,
respectively.
In this example, the background fit interval used has the following
boundaries: [-130 s, -40 s]  [150 s, 250 s], where t=0 s
is the GRB off-line trigger time.
[150 s, 250 s], where t=0 s
is the GRB off-line trigger time.
Next: Spikes' Remotion
Up: Background Fit
Previous: Background Fit
Contents
Cristiano Guidorzi
2003-07-31