Single Value Representation of Sound Spectrum
Home Up The Human Ear Frequency and Loudness Response of Ear Effect of Noise on Man Single Value Representation of Sound Spectrum


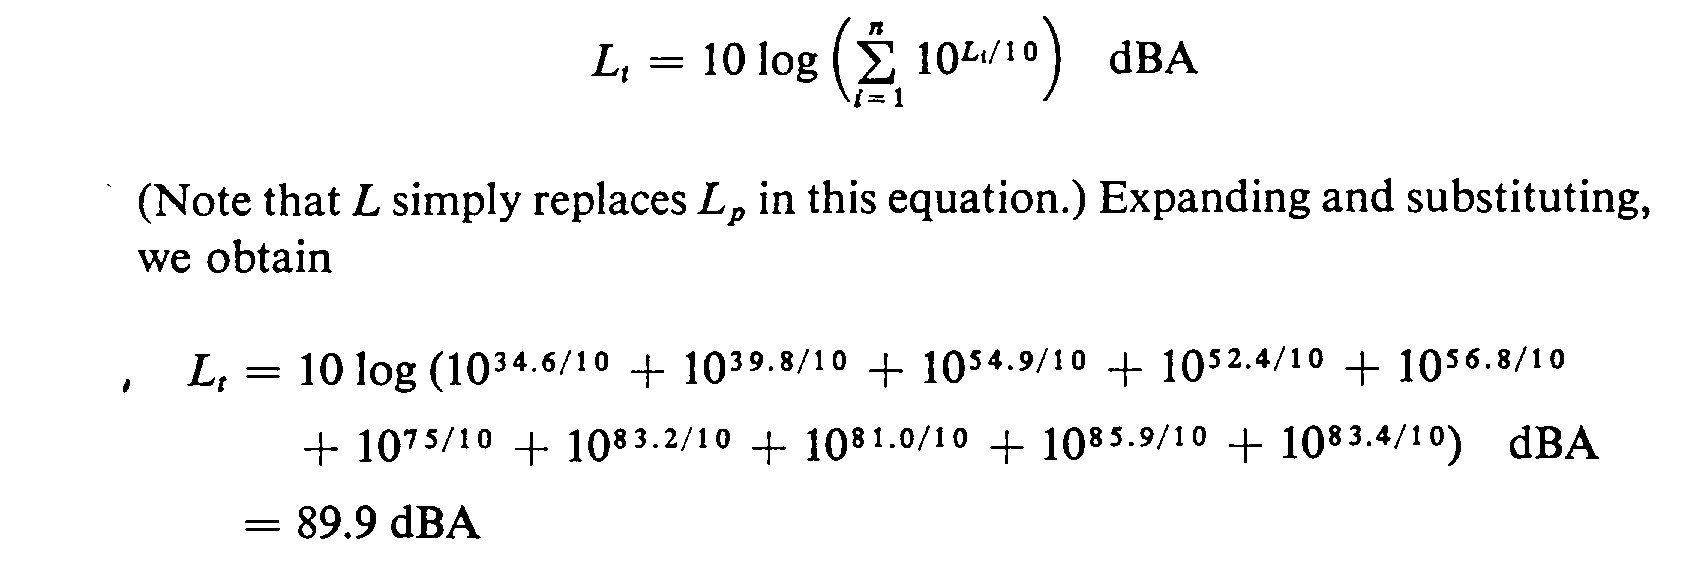
4. Single Value Representation of Sound Spectrum

Sometimes, a single numerical value is used to describe a sound which has a spectrum over a wide frequency range. Many methods and parameters have been derived to achieve this purpose. They are of course less precise and sometimes may cause confusion. Nevertheless, they are quite useful because of their simplicity. Some common examples are described below:

(a) NC, PNC & NR Curves

Noise-Criterion (NC) Curves

The set of curves, as shown in Fig. 7, were established in 1957 in U.S. for rating indoor noise, e.g. noise from air-conditioning equipment. For a given noise spectrum, the NC rating can be obtained by plotting its octave band levels on the set of NC curves. The noise spectrum is specified as having a NC rating same as the lowest NC curve which is not exceeded by the spectrum.

For example, a sound having the following octave-band noise :


Centre Frequency (Hz)

62.5

125

250

500

1K

2K

4K

8K

Band Pressure Level (dB)

41

45

48

50

46

42

40

38


is rated as NC-46 since when plotted in Fig. 7, it exceeds the NC-45 curve by 1 dB at 500 Hz.

Preferred Noise-Criteria (PNC) Curves

The PNC curves was introduced in 1971 as a modification on the NC curves in response to criticism that in offices designed to NC curves the air-conditioning noise was too "rumbly" and "hissy". The curves are shown in Fig. 8. The above quoted noise spectrum has a PNC-47 rating as it exceeds the PNC-45 curve by about 2 dB at 4 kHz.

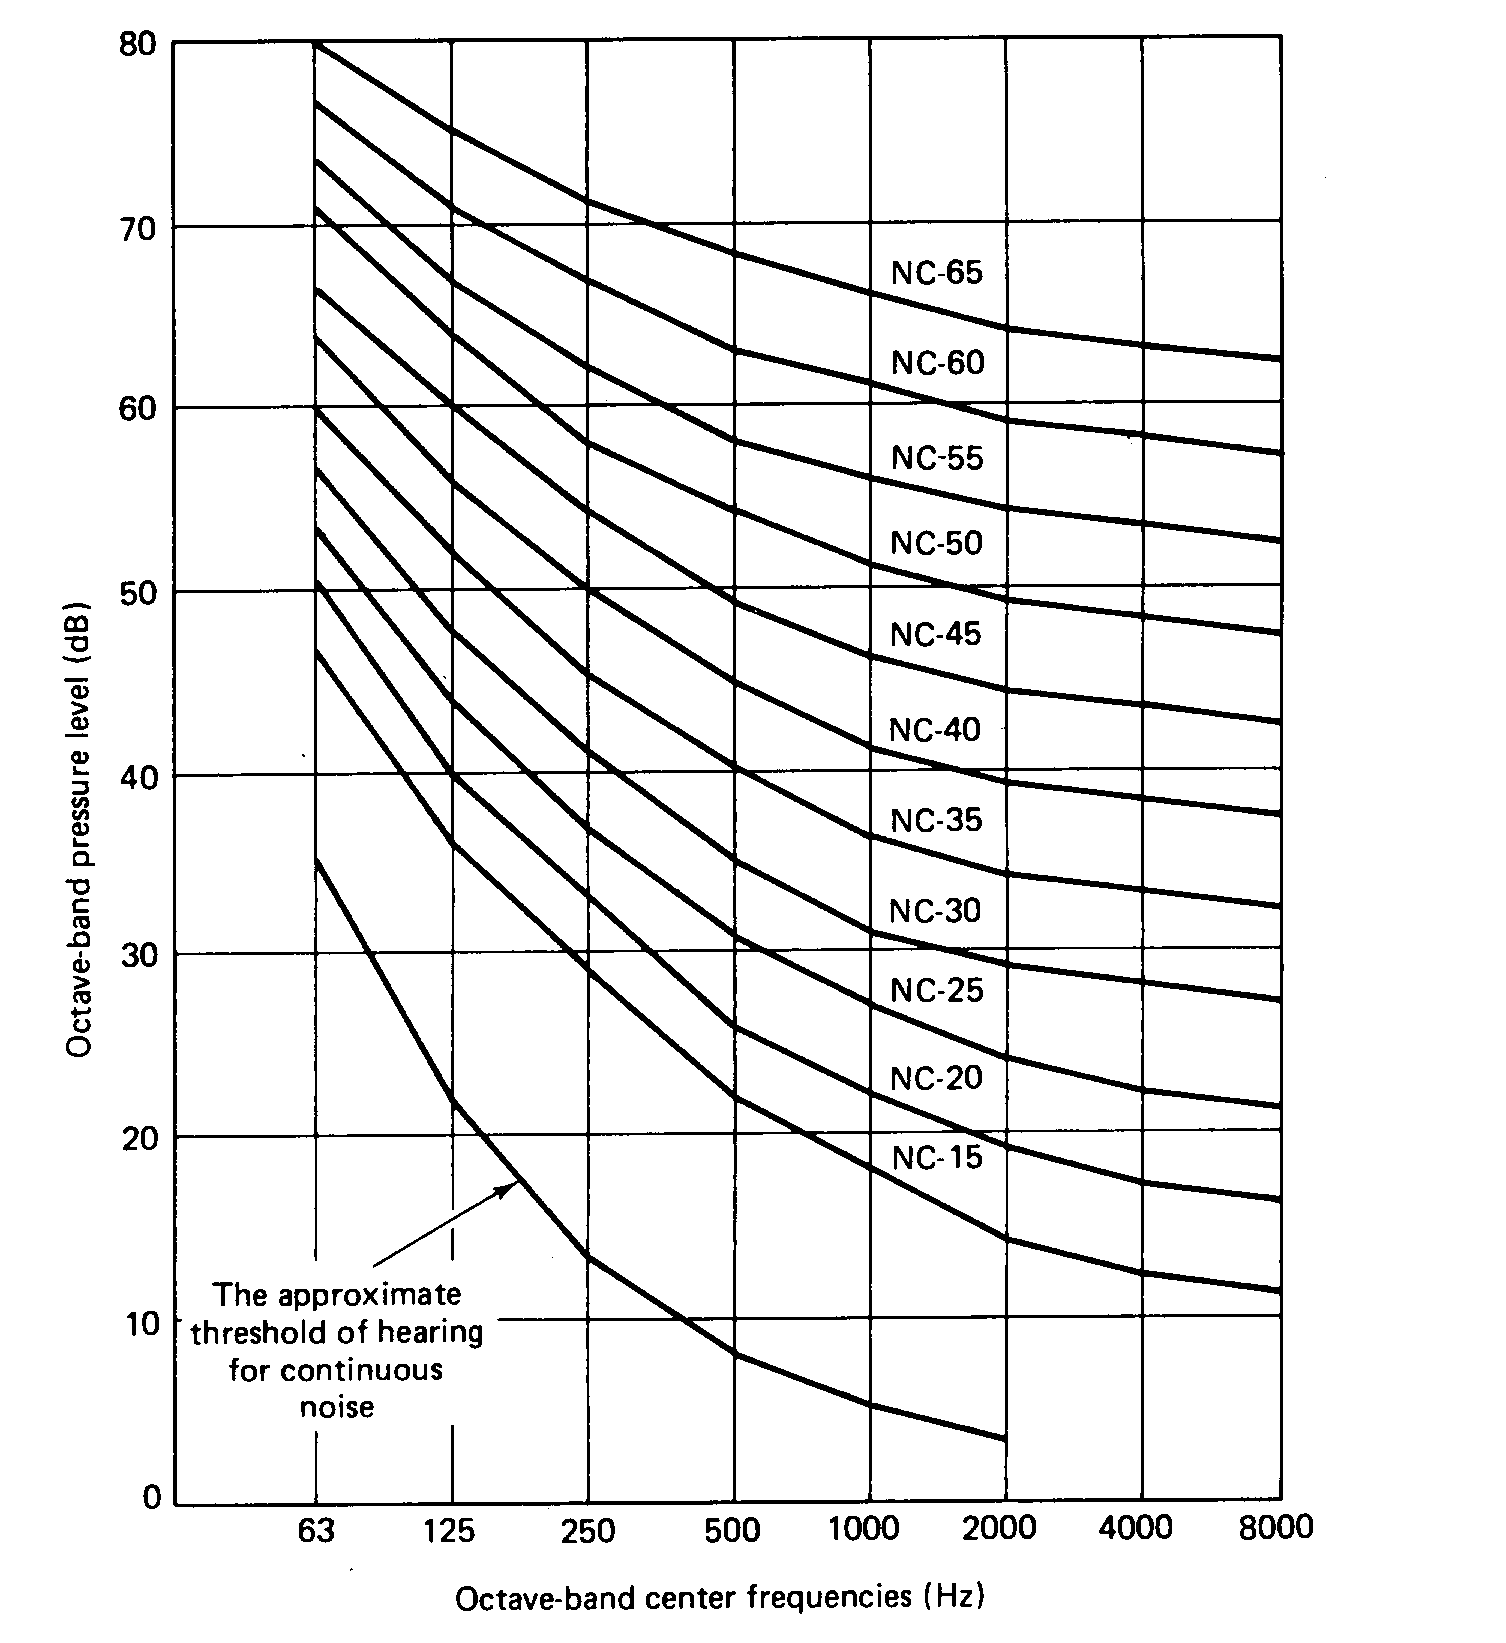
Figure 7 Noise Criteria (NC) Curves


PNCcurve.jpg (113699 bytes)

Figure 8 Preferred Noise Criteria (PNC) Curves


Table 3 illustrates some recommended noise criteria range for steady indoor background noise.


NC curve

PNC curve

1. Sleeping quarters

25 - 35

25 - 40

2. Living quarters

35 - 45

30 - 40

3. Office or classroom

30 - 35

30 - 40

4. Recording studio

15 - 20

10 - 20

5. Retail store or restaurant

35 - 50

35 - 45

6. Laboratory

40 - 45

40 - 50

7. Computer areas

45 - 60

45 - 55

Table 3 Recommended Noise Criteria Range

for Steady Indoor Background Noise

Noise Rating (NR) Curves

These curves are developed in Europe to assess community noise complaints. They are shown in Figure 9. Their use is similar to that for the NC and PNC curves.

(b) The Weighted Scales

The weighted scales are designed to quantify sounds or noises by one single value and yet do not have to refer to graphs or curves. The single numerical values are called sound levels.

The octave-band pressure levels are adjusted individually before they are combined to form one single number. The normalization is shown in Fig. 10, and is intended to give a better subjective evaluation of the impact of noise or sound upon the human ear.

Four weighting scales: A, B, C and D were introduced. These weighting curves are in fact the inverse of equal loudness curves and taking the fact that the equal loudness curves get flatter as sound pressure level increases. The A-weighting was for sound pressure levels below 55 dB; B-weighting for levels between 55 and 85 dB; C-weighting for levels above 85 dB; and the D-weighting for even higher levels. Nevertheless, the A-weighting is now used almost exclusively in measurements that relate directly to human responses, both from the view point of hearing damage and of annoyance.

The formula for converting octave-band sound pressure levels into sound levels on the X-weighting scale, X being A, B, C, or D, is:

(1)


LX-weighting = sound level on the x-weighting scale, dB(X)

Lpi = sound pressure level for the ith octave band, dB

F = correction factor, dB

The values of the correction factors are given in Table 4.

NRcurve.jpg (281762 bytes)

Figure 9 Noise Rating (NR) Curves


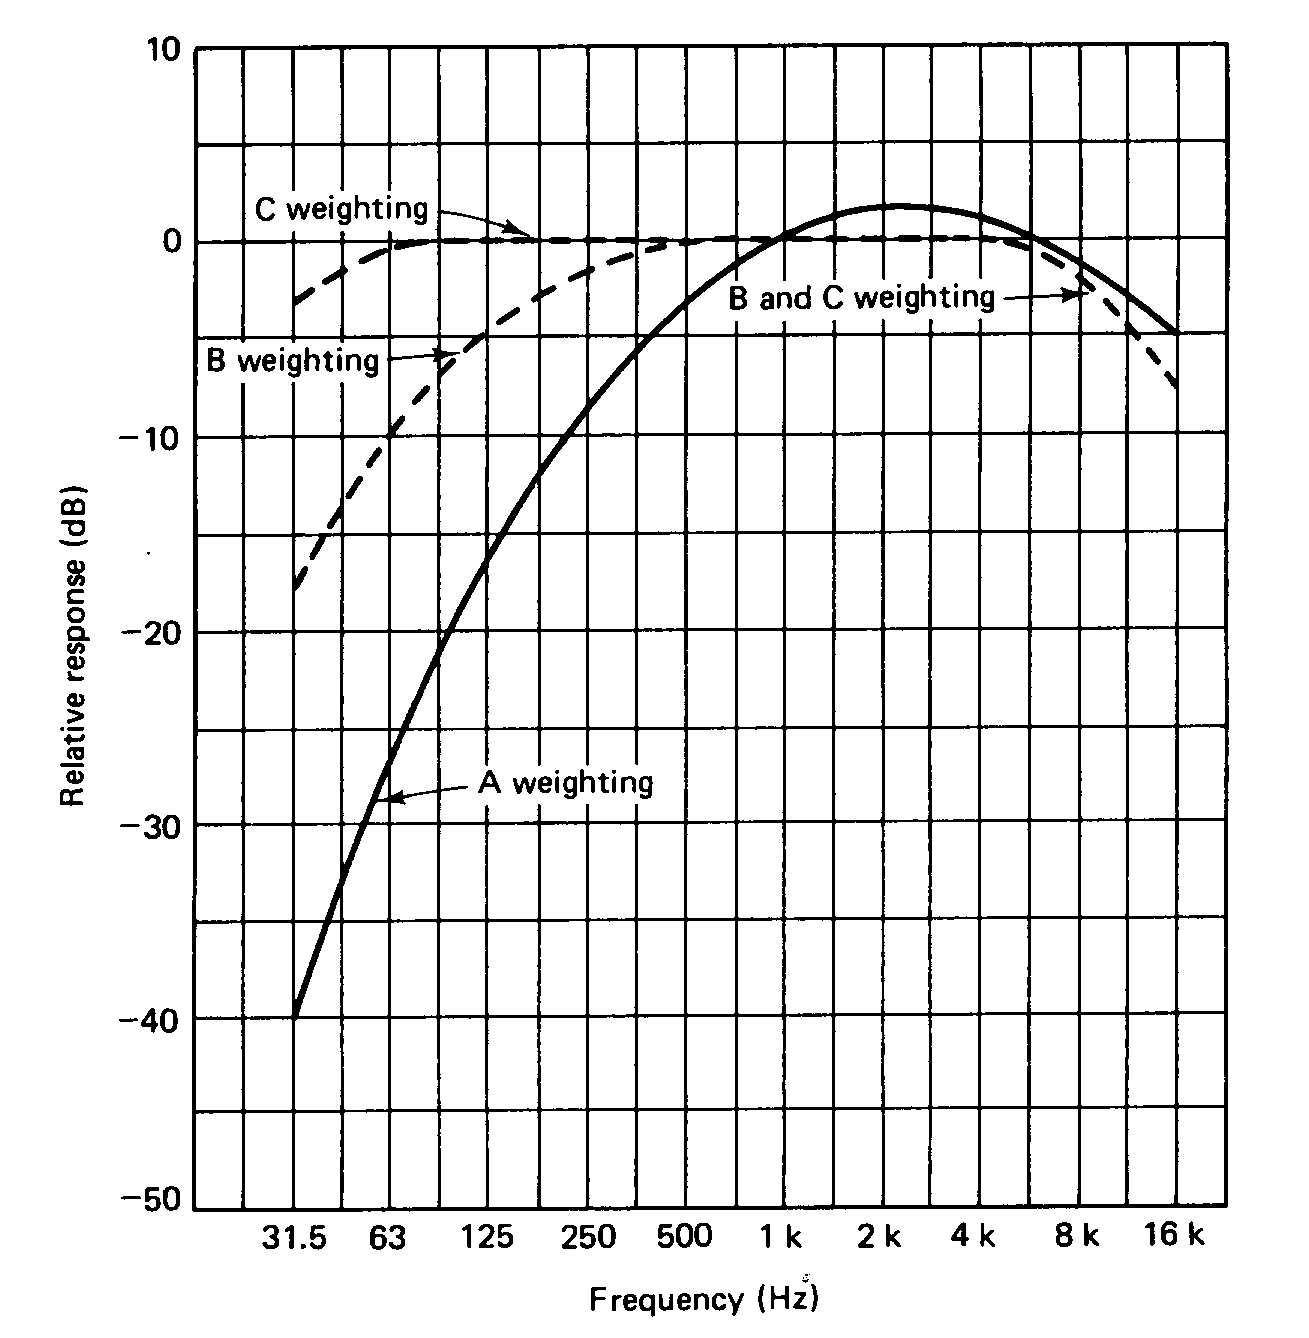
Figure 10 Frequency Response for the A, B and C Weighting Networks


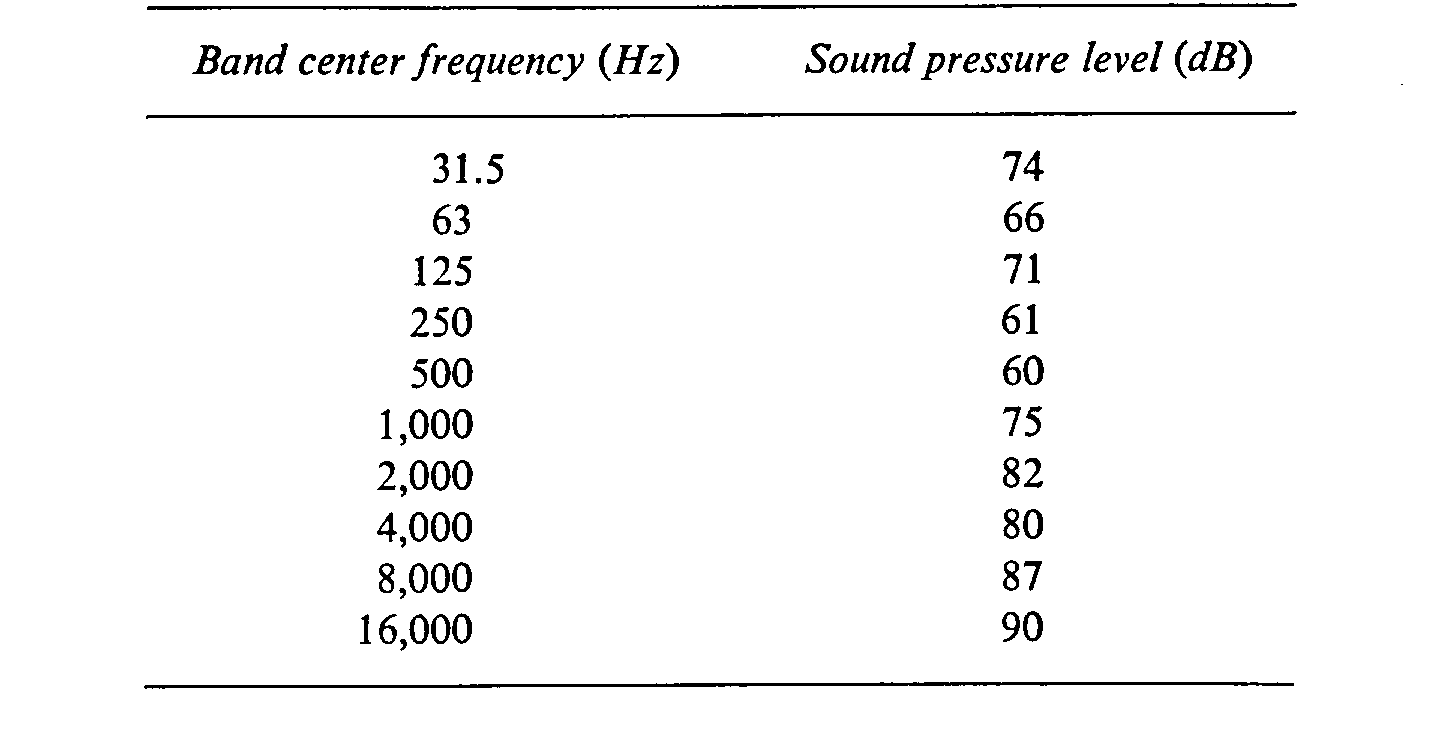
Table 4 Sound Level Conversion Chart from

Flat Response to A, B and C Weightings

Example 1

Determine the total A-weighted sound level of the following set of octave-band sound pressure levels :


Solution :

For the dB conversion from a flat response to dBA for each of the octave band :


Then sum the dBA in each of the bands for the total sound level :

The use of sound levels to describe sounds or noises can be quite misleading and may lead to confusion. In fact, it can be shown that two sounds or noises of totally different spectra and hence different impacts can have the same value of sound level.

There is no direct conversion from NC or NR rating (which measures acceptability) to dBA value (which measures loudness). However, a rough rule of thumb is:

(2)

This actually varies considerably, depending on spectrum shape. The constant term could lie between 0 and +11.

(c) Equivalent Continuous Sound Level (LAeq)

This is the steady-state A-weighted sound level that has the same acoustic energy as that of the time-varying sound averaged over the specified time interval. See Fig. 11.

LAeq.jpg (47299 bytes)

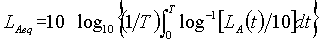
Figure 11 Equivalent Continuous Sound Level

LAeq can be estimated from a record of A-weighted sound level verse time by using the definition :

(3)

where LA(t) = instantaneous A-level of sound

T = specified time period during which sound is sampled

By breaking the sound-level record into n nos of 
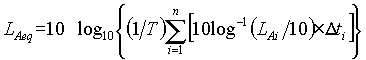
equal increments of time , equation (3) can be approximated by :

(4)

where LAi = average A-level over the ith increment of time


Example 2

The one-minute measurement of a time-varying sound recorded that :

Lp = 60 dBA for 50 sec

= 80 dBA for 10 sec

LAeq = 10 log{(1/60) x [10(60/50) x 50 + 10(80/10) x 10]}

= 72.4 dBA