


Next: List of Tables
Up: doktorthese
Previous: Contents
Contents
- GRBM light curves of bursts.
- Duration (
 ) Distribution of 2704 BATSE bursts
(from http://www.batse.msfc.nasa.gov/batse/grb/duration/).
) Distribution of 2704 BATSE bursts
(from http://www.batse.msfc.nasa.gov/batse/grb/duration/).
- HR-Duration () Correlation of GRBs. The squares spot the WFC/BeppoSAX
bursts: to date, it has been possible to detect afterglows only from long bursts
(from http://www.batse.msfc.nasa.gov/batse/grb/4bcatalog/.)
- Direction distribution of 2704 bursts detected by BATSE
(from http://www.batse.msfc.nasa.gov/batse/grb/skymap/).
- LogN-LogS Distribution for 799 BATSE bursts (from [Kouveliotou, 1992]).
- Redshift Distribution (Nov 2001).
- Isotropic energy, fluence and host magnitude (
 and
and
 filters) as a function of redshift (Nov 2001; from [Ghisellini, 2001]).
- Rebrightening of the GRB980326 optical afterglow: it might be
connected with an underlying SN. Here the R-band light curve has been fitted
with an initial power law decay plus a SN Ic light curve for the redshift
range
 . The best-fit redshift occurs at
  and seems
consistent with the observed spectrum (from [Bloom et al., 1999]).
and seems
consistent with the observed spectrum (from [Bloom et al., 1999]).
- Energy Distribution of GRBs with known redshift in two cases:
isotropic emissions (top panel), and geometry-corrected for jet-like
emissions (bottom panel). The non-isotropic case tightly clusters the
distribution around
 erg. (From [Frail et al., 2001]).
- The two different cases of spherical and jet-like emission:
the visibility cone, defined by the time-evolving bulk Lorentz factor,
should distinguish at late times between the two cases. (From [Ghisellini, 2001]).
- Cartoon for the Fireball Model.
- Broad Band Synchrotron Spectrum of a GRB afterglow, according
to the Fireball Model. (From [Sari, Piran & Narayan, 1998])
- GRB-Host Galaxy Offset Distribution. It seems to
favour a progenitor population associated with star forming
regions. (From [Djorgovski et al., 2001]).
- The IPN triangulation method.
- Ulysses-Earth distance as a function of time.
- Schematic view of the Rossi-XTE payload.
- Schematic view of HETE-II.
- Sketch of the BeppoSAX satellite structure (From Piro 1995).
- The BeppoSAX Scientific Payload
- The PDS and GRBM experiments.
- A Sketch of the PDS and of its electronics (from [Frontera et al. 1997a]).
- The Ground Support Facilities and Data Flow
(from [Bruca L. et al., 1998a]).
- Linear fit of the OBT-UT relationship in the case
of the OP 11729 (July, 31 - August, 1, 2001).
In the upper panel, the conversion
couples concerning the overall OP, the best linear fit
and the temporal residuals are plotted : in the case of
FOT data, a unique linear fit is performed on data taken
from several contiguous orbits.
In the lower panel, the zoom on a single orbit data from
the same OP is shown: in this figure, the fit is the same
as before, but when dealing with RAW data, the OBT-UT conversion
is performed one orbit at a time.
- Top panel: schematic top view of the payload model:
the two couples of NFIs, the HPGSPC (right) and the WFC
box (left) are clearly visible around the PDS/GRBM square box.
Bottom panel: side view of the model: the orange box
represents the electronics, while the pedestal (used during
the on-ground calibration sessions) is violet
(from [Calura et al., 2000]).
- GRBM Localization of GRB980109: the different
 levels
are shown; The triangle denotes the burst position as determined by the
WFC, while the asterisk spots the GRBM centroid.
levels
are shown; The triangle denotes the burst position as determined by the
WFC, while the asterisk spots the GRBM centroid.
- GRBM Localization of GRB000516: the different levels
are shown; The triangle denotes the burst position as determined by the
IPN, while the asterisk spots the GRBM centroid.
- GRBM Localization of GRB990627: the different levels
are shown; this localization shows different relative minima.
- GRBM 1 s light curves, one for each energy band and for each unit
(OP 11729, from July 31 to August 1, 2001). From top to bottom, the GRBM 1-4
and AC 1-4 bands are plotted. The duration is
 s.
The count rates are measured in counts/s: actually, for clarity,
these rates are the averages of 20 s bins; however, in the GRBM band,
softer than the AC band, it is apparent that there are more spikes.
The repetitive structures have the same periodicity of the BeppoSAX orbital
period; the periodic data gaps correpond to the SAGA passages.
s.
The count rates are measured in counts/s: actually, for clarity,
these rates are the averages of 20 s bins; however, in the GRBM band,
softer than the AC band, it is apparent that there are more spikes.
The repetitive structures have the same periodicity of the BeppoSAX orbital
period; the periodic data gaps correpond to the SAGA passages.
- GRBM 1 s light curves, one for each energy band and for each unit
(orbit n. 26855, August 2, 2001). The duration is
 6000 s.
These are the typical time profiles of the GRBM ratemeters during a single orbit.
At
6000 s.
These are the typical time profiles of the GRBM ratemeters during a single orbit.
At  30921 SOD, corresponding to 08:35:21 UT, the GRB010802 was detected
by the automatic on-line quest (automatic mail n. lkGRB[268]): in this case,
the GRB was bright enough to be detected in all units, in both energy bands.
30921 SOD, corresponding to 08:35:21 UT, the GRB010802 was detected
by the automatic on-line quest (automatic mail n. lkGRB[268]): in this case,
the GRB was bright enough to be detected in all units, in both energy bands.
- Example of moving parabolic fit applied to estimate
the expected background counts for each bin. For a detailed description,
see the section about the late SWTCs. In this case, both the energy
bands of unit 1 are shown (OP 04421, May 1998). The +2
 level
over the expected background is plotted.
level
over the expected background is plotted.
- Distributions of the counts (unit 1, GRBM band in the left and
AC band in the right panel, respectively) taken from
the OP 04421 (May 9-10, 1998), lasted s. A moving parabolic
fit estimates the background counts expected for each time bin: here
the deviations of the measured counts from the corresponding
values are expressed in , calculated as the square root
of the expected counts. The s of the
best fitting normal distributions are consistent with the
poissonian s.
- Distributions of the counts (unit 1, GRBM band in the left and
AC band in the right panel, respectively) taken from
the OP 00915 (September 13, 1996), lasted 9500 s.
This is a rare OP, because it shows a non-poissonian
noise, since the standard deviation of its distribution
is
 times the poissonian .
- Example of a strong spike occurred in unit 1, GRBM band,
at 11:25:43.06 UT, on August 26, 2001.
Left panel: 1 s bin profile; right panel: same profile with a 7.8125 ms
resolution. The typical exponential decay is clearly visible: in this
case, a least square fit estimates the exponential decay constant
 ms,
ms,
 . The dip, visible
in the middle of the HTR pulse, is fake and it is due to the
6 bit counters' recycling.
. The dip, visible
in the middle of the HTR pulse, is fake and it is due to the
6 bit counters' recycling.
- Example of solar X-ray flare detected by the GRBM, units 2+3,
on April 15, 2001, at 13:44 UT (upper panel: GRBM band; lower panel:
AC band). This flare shows a ``curious''
profile: the fast drop has been caused by the occultation of the Sun
behind the Earth, as seen from the BeppoSAX point of view.
- Example of a pre-SAGA event, occurred on July 30, 1999.
- Two single occultation steps in the GRBM band, unit 1: left panel:
Crab (

 ,
,  , OP 03991); right panel:
CygX-1 (
, OP 03991); right panel:
CygX-1 ( , , OP 04421).
- Summed occultation steps of Crab in the GRBM band, unit 1:
left panel: occ. beginning; right panel: occ. end (OP 03991).
- Summed occultation steps of CygX-1 in the GRBM band, unit 1:
left panel: occ. beginning; right panel: occ. end (OP 04421, May 1998).
- Time history of NTB 960723, UT 04:46:03, (also BATSE trigger
5551) in all the GRBM units, both energy bands. Only unit 2 detected it.
This NTB was caught trough SWTC 2: actually,
its BATSE direction was 70above the Earth limb and
11off-axis with respect to unit 2.
- Time history of NTB 960802 (also BATSE trigger 5559) in all
the GRBM units, both energy bands. Only unit 1 detected it.
Like NTB 960723, also this NTB was caught trough SWTC 2:
its BATSE direction was 20above the Earth limb and
18off-axis with respect to unit 1.
- Time history of NTB 980421 (also BATSE trigger 6698) in all
the GRBM units, both energy bands. The burst can be seen in
all the profiles, but it matched the OBTC only in unit 1, because
too faint in the other units. It triggered both SWTC 2 and SWTC 3.
Its BATSE direction was 73above the Earth limb and
55off-axis with respect to unit 1, the one with the best
SNR.
- Time history of NTB 960913 (also BATSE trigger 5604) in all
the GRBM units, both energy bands. The burst was bright enough in
the units 2 and 3 to match the OBTCs, but, since it occurred during
the dead time of a previous fake event that triggered the GRBM, there
are no HTR counts of it. It triggered all the SWTCs.
Its BATSE direction was
 and
and
 in the BeppoSAX frame of reference, i.e. bewteen the axes of units 2 and 3:
this fully agrees with the GRBM units that indeed detected it.
in the BeppoSAX frame of reference, i.e. bewteen the axes of units 2 and 3:
this fully agrees with the GRBM units that indeed detected it.
- The OTB 970315 (left: 40-700 keV, right:
 100 keV)
occurred just before the SAGA transit
(unit 1, 40-700 keV energy band). The parabolic background fit is
overplotted: this was estimated after visual inspection,
by using a proper interval preceding the burst.
100 keV)
occurred just before the SAGA transit
(unit 1, 40-700 keV energy band). The parabolic background fit is
overplotted: this was estimated after visual inspection,
by using a proper interval preceding the burst.
- Time profiles of NTB 010518 in both energy bands of unit 3,
that detected it: this burst did not trigger the on-board
logic, because too faint; nevertheless, it triggered the SWTC 4,
making it possible to discover the faint X-ray counterpart in the
WFC 2 (GCN 1062).
- Time profiles of NTB 980511, also detected by BATSE
(# 6753); this GRB triggered SWTC 3, thanks to the counts
in the units nn. 2 and 3, the two brightest ones (this agrees
with the BATSE direction,
 ,
,  ).
A small data gap is visible
).
A small data gap is visible  s before the GRB.
The background fits and the +2 levels are
overplotted, as well. The two intervals around the burst, used for
fitting, are highlighted.
s before the GRB.
The background fits and the +2 levels are
overplotted, as well. The two intervals around the burst, used for
fitting, are highlighted.
- Time profiles of the short NTB 961116;
this GRB triggered SWTC 2 in the units nn. 1 and 2.
The background fits and the +2 levels are overplotted, as well.
The two intervals around the burst, used for fitting, are highlighted.
The presence of a spike at
 s little biases the fit in the cases
of GRBM1 and GRBM4; this spike triggered the on-board logic ``just too
early'', preventing the GRBM from acquiring HTR data of the NTB.
s little biases the fit in the cases
of GRBM1 and GRBM4; this spike triggered the on-board logic ``just too
early'', preventing the GRBM from acquiring HTR data of the NTB.
- Scheme of the on-line quest.
- GRBM unit # 3 light curves of GRB010317: the automatic
background fit is shown.
- Example of a 31.25 ms GRBM light curve used for the IPN:
GRB010412.
- The Ulysses-BeppoSAX annulus intersects the WFC error
circle of GRB010412 (courtesy of K. Hurley).
- GRB010923: the triangle spots the IPN position
(
 ,
,
 ) while the
asterisk denotes the GRBM position centroid
(
) while the
asterisk denotes the GRBM position centroid
(
 ,
,
 )
and the cross corresponds to the 2nd, wrong IPN solution
(
)
and the cross corresponds to the 2nd, wrong IPN solution
(
 ,
,
 )
: the GRBM position allowed to resolve the IPN ambiguity.
)
: the GRBM position allowed to resolve the IPN ambiguity.
- GRB010923: the IPN triangulation redundancy is
resolved by means of the GRBM error circle, as it includes
only one of the two possible intersection regions (courtesy of K. Hurley).
- Examples of localization of two IPN bursts: both GRB000630
(left panel) and GRB001204 (right panel) were detected by Ulysses,
BeppoSAX/GRBM, Konus/WIND and NEAR. In both cases,
the two IPN annuli, crossing each other, are shown.
Only for the first an afterglow was found (optical band);
GRB001204 was a short duration burst (courtesy of K. Hurley).
- GRB010304. Top panel: 40-700 keV GRBM3 light curve; bottom
panel: 2-28 keV WFC2 light curve (courtesy of J.J.M. in 't Zand).
Example of WFC burst that did not trigger the GRBM on-board logic,
but did the automatic GRB on-line quest (lkGRB[171]).
The zero time corresponds to the S/W trigger time.
- GRB010501, UT 06:37:27
Top panel: 40-700 keV GRBM1 light curve; bottom
panel: 2-28 keV WFC1 light curve (courtesy of J.J.M. in 't Zand).
This faint burst did trigger the on-line quest, and was missed
by the GRBM on-board logic, (lkGRB[206]).
The zero time corresponds to the S/W trigger time.
- GRB010518, UT 06:43:09
Top panel: 40-700 keV GRBM3 light curve; bottom
panel: 2-28 keV WFC2 light curve (courtesy of J.J.M. in 't Zand).
Another example of faint burst that did trigger the on-line quest,
and was missed by the GRBM on-board logic, (lkGRB[218], GCN 1062).
- GRB010213, UT 02:57:23
Top panel: 40-700 keV GRBM3 light curve; bottom
panel: 2-28 keV WFC2 light curve (courtesy of J.J.M. in 't Zand).
This bright burst did not trigger the GRBM on-board logic,
because it occurred during the GRBM dead time;
since the on-line quest was off, it was missed at the
epoch and finally discovered during an off-line search.
- GRB961228, UT 00:29:58, is an example of a GRBM-BATSE common burst.
Upper panel: GRBM 40-700 keV light curve (summed counts of all units);
lower panel: BATSE
 keV light curve.
- GRB980923, UT 08:22:58, is an example of a GRBM-Stern's BATSE
common burst. Upper panel: GRBM 40-700 keV light curve (unit 3);
lower panel: BATSE
 keV light curve as taken from Stern's catalog
(event identificator: 11079d).
keV light curve as taken from Stern's catalog
(event identificator: 11079d).
- GRBM off-line efficiency as a function of the local direction
(aitoff projection); these values have been obtained by splitting the
local sky according to two regular grids: cube- and dodecahedron-shaped;
then, the results have been merged into a unique figure.
- Background Fit for GRB000830, UT 11:39:08. From top to bottom:
GRBM1, ..., GRBM4, AC1, ..., AC4.
- Background subtracted light curves of GRB000830, UT 11:39:08.
From top to bottom: GRBM1, ..., GRBM4, AC1, ..., AC4.
- Estimation for GRB000830, UT 11:39:08.
Top panel:
 ms light curve for the GRBM 3+2 energy bands.
Bottom panel: integrated light curve, with the 0%, 5%, 95% and
100% fluence levels shown.
ms light curve for the GRBM 3+2 energy bands.
Bottom panel: integrated light curve, with the 0%, 5%, 95% and
100% fluence levels shown.
- Sky Exposure (equatorial coordinates).
- Sky Exposure (galactic coordinates).
- Sky Exposure as a function of Declination.
- BeppoSAX Local Sky Exposure (GRBM units 1, 2, 3, 4
axes point to
 ,
respectively, with
,
respectively, with
 for all).
- BeppoSAX Local Sky Exposure as a function of the local
elevation angle
 for four different
, corresponding to the normal directions of GRBM
units 1, 2, 3, 4, respectively.
for four different
, corresponding to the normal directions of GRBM
units 1, 2, 3, 4, respectively.
- and
 Distributions of 891 GRBs detected
by the GRBM (40-700 keV).
Distributions of 891 GRBs detected
by the GRBM (40-700 keV).
- Distribution of 777 GRBs and Distribution
of 689 GRBs (40-700 keV). Only durations known with at least 3
significance have been taken.
- HR-Duration Correlation of 891 GRBM bursts. In the upper panel,
duration is expressed in terms of , while has been
used in the lower panel.
- HR-Duration Correlation of 501 () and 497 ()
GRBM bursts. In the upper panel, duration is expressed in terms
of , while has been used in the lower panel.
- HR Distribution of 891 GRBs from the GRBM catalog.
- HR Distribution of 790 GRBs from the GRBM catalog, with
at least 3 significant HRs.
- Direction Distribution of 362 GRBs from the GRBM catalog, in
common with BATSE 4B, Kommers' and Stern's catalogs. The directions are
taken from these catalogs (galactic coordinates, aitoff projection).
- Direction Distribution of 639 GRBs from the GRBM catalog; 79
well localized GRB positions, 283 from BATSE 4B, 18 from Kommers',
61 from Stern's,and 198 GRBM positioned GRBs
(galactic coordinates, aitoff projection).
- Direction Distribution of 362 GRBs from the GRBM catalog, in
common with BATSE 4B, Kommers' and Stern's catalogs. The directions are
taken from these catalogs (aitoff projection).
Upper panel: BeppoSAX local coordinates; bottom panel: equatorial
coordinates (in this case, only the 283 common BATSE 4B bursts are shown.
- GRBM-true Position Angular Distance Distribution. The sample
only includes 45 well localized GRBs (WFC, IPN, etc...).
- GRBM-BATSE Position Angular Distance Distribution. The sample
only includes 152 BATSE 4B GRBs, that have been localized also with the GRBM
localization technique.
- GRBM-BATSE Position Angular Distance Distribution. The sample
only includes 203 BATSE (4B+Kommers'+Stern's) GRBs, that have been
localized also with the GRBM localization technique.
- GRBM-BATSE Position Discrepancy Distribution. The sample
only includes 152 BATSE 4B GRBs, that have been
localized also with the GRBM localization technique. The discrepancy
takes into account both the total error (90% CL) owing to the GRBM localization
and the total BATSE error, with
 systematic for the latter.
- GRBM-BATSE Position Discrepancy Integral Distributions. The sample
only includes 152 BATSE 4B (top panel) and 203 BATSE 4B+Kommers'+Stern's
(bottom panel) GRBs, that have been
localized also with the GRBM localization technique. The discrepancy
takes into account both the total error (90% CL) owing to the GRBM localization
and the total BATSE error, with
systematic for the latter.
- GRBM Direction Distribution of a sample of 446 GRBs localized
with the GRBM localization technique. The frame of reference is local
to BeppoSAX. The clustering tendency in the nearby of the BeppoSAX
equatorial plane is apparent.
- Direction Distribution of the GRBM-BATSE (4B) common
sample of 152 GRBs localized with the GRBM localization technique.
The frame of reference is local to BeppoSAX. Both GRBM and BATSE
positions are spotted. The clustering tendency in the nearby of the BeppoSAX
equatorial plane is apparent, when compared with the BATSE distribution.
- Direction Distribution of a sample of 45 GRBs, that have been
localized with the GRBM localization technique, and whose position was
already known thanks to other experiments, mainly WFC and IPN.
The frame of reference is local to BeppoSAX. Both GRBM and true positions
are shown.
The clustering tendency in the nearby of the BeppoSAX equatorial plane
is apparent.
- Top panel: cumulative fluence distribution (40-700 keV).
The solid line shows the best powerlaw fit
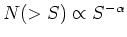 ,
with
,
with
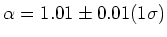 ; the dashed line shows the case
 .
Bottom panel: cumulative peak countrate distribution (40-700 keV);
the best fit gives
.
Bottom panel: cumulative peak countrate distribution (40-700 keV);
the best fit gives
 .
.
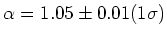
- Top panel: cumulative fluence distribution ( 100 keV).
The solid line shows the best powerlaw fit
,
with
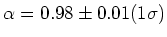 ; the dashed line shows the case
.
Bottom panel: cumulative peak countrate distribution ( 100 keV);
the best fit gives
; the dashed line shows the case
.
Bottom panel: cumulative peak countrate distribution ( 100 keV);
the best fit gives
 .
.
- GRBM Light Curves of some SGR1900+14 bursts (40-700 keV).
- GRBM Light Curves of other SGR1900+14 bursts (40-700 keV).
- GRBM Light Curves of some SGR1627-41 bursts (40-700 keV).
- GRBM Light Curves of other SGR1627-41 bursts (40-700 keV).
- GRBM Light Curves of two bursts from SGR1806-20 (40-700 keV).
- GRBM3 Time Profiles of 980901, UT 17:06:27.06, from SGR1900+14:
the overall profile (3) is split into three slices:
(3a), (3b), (3c).
- GRBM average spectrum of 980901, 17:06:27.06 UT, from SGR1900+14.
The best fit with a black body law yields
 keV,
keV,
 .
.
- Background subtracted light curves of two giant flares from
SGR1900+14: August 27, 1998 (top), April 18, 2001 (bottom).
The
 s modulation is apparent in both cases. In the 1998 case,
the initial spike is affected by the GRBM counters' recycling.
s modulation is apparent in both cases. In the 1998 case,
the initial spike is affected by the GRBM counters' recycling.
- GRBM Spectra of the two Giant Flares: August 1998 (slice B) (top) and
April 2001 (slice A) (bottom). Both have been fitted with black body plus
broken power law;
 for both cases. (From Guidorzi
et al., 2002, in preparation)
for both cases. (From Guidorzi
et al., 2002, in preparation)
- The light curves of both giant flares (first 40 s) are compared,
according to two different offsets: by making the two steepest rises (top panel),
and the two onsets (bottom panel) coincide, respectively;
(August 98 is grey; April 01 is black). The slices have the s periodicity.
- The huge April 02, 2001, solar flare as seen by
the GRBM (UT 21:36:40): no dead time correction.
The 1 s ratemeters recycled in several 1 s bins.
(GRBM unit 2, 40-700 keV).
- May 4, 1998, solar flare (UT 09:29:17), as seen by
the GRBM (40-700 keV and 100 keV time profiles are shown
in the top and bottom panels, resp.): this flare lasted
24 min (GRBM units 1+3).
- GRBM light curves of GRB980516 (from top to bottom: GRBM1, ...
GRBM4, AC1,..., AC4.
- Zoomed background subtracted light curves of the GRBM 1+2 units;
in both energy bands (top: 40-700 keV; bottom: 100 keV) the onset is
clearly visible at
 s.
s.
- GRBM average spectra of GRB980516. Top panel: fit with the Band
Law (
 ); middle panel: fit with a broken power law (unfolded
spectrum,
); middle panel: fit with a broken power law (unfolded
spectrum,  ); bottom panel: fit with a single power
law (unfolded spectrum,
); bottom panel: fit with a single power
law (unfolded spectrum,  ).
).
Cristiano Guidorzi
2003-07-31